
Psychiatry Journal Club: Biostatistical Viewpoints
Residents Journal Club 2015-10-21
Prescription practices in the treatment of first-episode schizophrenia spectrum disorders: Data from the national RAISE-ETP study. DG Robinson et al, Am J Psychiatry 2015; 172:237-248; doi: 10.1176/appi.ajp.2014.13101355- Review by Adam Pendleton and Madison Johnson
- The authors are to be commended for using a Bayesian approach for making inferences from logistic regression models
- The Bayesian approach allowed the authors to calculate direct probabilities of interesting things, unlike P-values which are probabilities of getting results more impressive than the observed results if nothing interesting is going on
- The paper computes posterior probabilities of being a risk factor
- Credible intervals are given for effects of regressors; these are the Bayesian analogs of confidence intervals but have a much simpler interpretation
- Bayes allows one to make exact inference, unlike traditional frequentist inference in which everything outside of ordinary regression uses approximations
- The authors used a wide distribution (Cauchy) as the prior distribution for each regression coefficient, after arbitrary scaling of the covariate
- They used the R
armpackage for the calculations. This package actually uses a rough approximation to full Bayes analysis by assuming that regression coefficients from an ordinary logistic model fit have a multivariate normal distribution. For logistic regression, such approximations are poor. The authors should have used exact Bayesian methods (e.g., the R packageMCMCpack). - They used model averaging which was not needed at all in this context
- The authors are confused about statistical terminology. Multivariate was used to refer to multivariable (adjusted) analyses but should be reserved to refer only to the case where one is simulatneously analyzing multiple dependent variables
The paper devoted an amazing amount of space to showing effects of all the predictors on the log odds ratio scale. For continuous variables such as age, odds ratios require arbitrary settings of age (2 values) and have difficulty placing the continuous variable's effect on the same scale as a categorical variable's effect. Odds ratios do not convey the needed impression because a risk factor that has a very low prevalence can have a large odds ratio. More to the point would be to compute some measures of how much of the variation in prescription patterns is explained by each patient or practice characteristic. This can be done quite concisely, and some characteristics can be pooled into classes. For example one could show the variation in prescribing a specific drug that is due to race and then the variation due to ethnicity. Then a combined race/ethnicity effect could be displayed. Likewise, geographical variables can be combined to display, using a single number, the variation due to location. These kind of "chunk tests" allow one to see what's going on when co-linearities cause risk factors to compete, knocking down each others' effects. The combined statistics allow them to sum their effects instead.
An example display is found below. Here what is being predicted is hemoglobin A1c, and the effect of various body dimensions (partial/adjusted effects) are shown individually as well as all pooled together.
- Variation in glycohemoglobin explained by various risk factors. From Regression Modeling Strategies, second edition by FE Harrell, 2015:
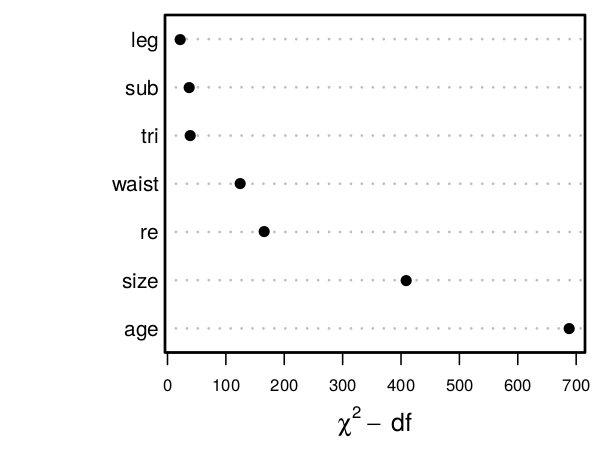
size entry sums the influence of leg length, subscapular skinfold thickness, tricep skinfold thickness, and waist circumference. re is a combined race + ethnicity multiple degree of freedom effect. Here the measure of explained variation is the Wald chi-square statistic minus the number of degrees of freedom required to achieve that chi-square. The subtraction is to level the playing field so that risk factors having many categories do not get more changes to explain variation in the outcome variable. 

| I | Attachment | Action | Size | Date | Who | Comment |
|---|---|---|---|---|---|---|
| |
anova.png | manage | 17 K | 18 Oct 2015 - 10:12 | FrankHarrell | Variation in glycohemoglobin explained by various risk factors |
| |
pendletonJohnsonReview.html | manage | 33 K | 21 Oct 2015 - 06:45 | FrankHarrell | Review of Am J Psychiatry March 2015 by Pendleton and Johnson |
Ideas, requests, problems regarding Vanderbilt Biostatistics Wiki? Send feedback