
You are here: Vanderbilt Biostatistics Wiki>Main Web>DynamitePlots (05 Jan 2011, TatsukiKoyama)Edit Attach
Dynamite Plots | http://emdbolker.wikidot.com/blog:dynamite More
- The height of a bar indicates the mean, and the vertical line on top of it represents the standard deviation (or standard error).
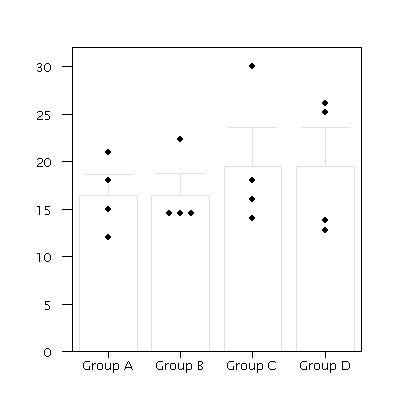
- When sample size is small (e.g., n < 15), a dynamite plot should be replaced by a dot plot in which every data point is represented.
- When sample size is large, a box plot should be used.
- Dynamite plots hide the raw data and typically only show one-sided confidence intervals. They usually assume the confidence interval is symmetric.
An example:
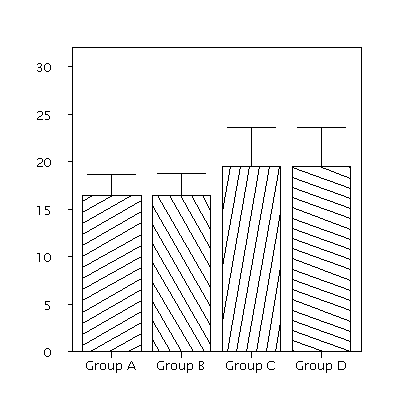
Means and standard deviations (or standard errors?) of Groups A and B look identical. But what does that mean? Group C and D look identical, too.
The same data are shown in a dot plot below.
A few examples
These may have some other statistical/graphical issues.- Potti A et al. Genomic signatures to guide the use of chemotherapeutics. Nat Med 2006. 12(11): 1294-1300. PMID: 17057710.
- Stephan MT et al. T cell-encoded CD80 and 4-1BBL induce auto- and transcostimulation, resulting in potent tumor rejection. Nat Med 2007. 13(12) 1411-1413. PMID 18026115.
- Von Hoff DD et al. Inhibition of the hedgehog patheway in advanced basal-cell carcinoma. N Engl J Med. 2009 361 (12): 1202-1205. PMID 19726763.
"Beware of Dynamite" poster
http://biostat.mc.vanderbilt.edu/twiki/pub/Main/TatsukiRcode/Poster3.pdfDepartmental Policy
At a department meeting on 18Oct06, statisticians in the department voted in favor of the policy regarding dynamite plots:Dynamite plots often hide important information. This is particularly true of small or skewed data sets. Researchers are highly discouraged from using them, and department members have the option to decline participation in papers in which the lead author requires the use of these plots.
R code
>> dot plotEdit | Attach | Print version | History: r11 < r10 < r9 < r8 | Backlinks | View wiki text | Edit wiki text | More topic actions
Topic revision: r11 - 05 Jan 2011, TatsukiKoyama
Ideas, requests, problems regarding Vanderbilt Biostatistics Wiki? Send feedback