You are here: Vanderbilt Biostatistics Wiki>Main Web>Projects>MicroArrayMassSpec>WfccmNotes>WfccmDataToolsVisualization (10 Jun 2005, NimishGautam)EditAttach
Data Tool and Visualization
Detailed Time Line and Tasks
SpecificationApr 18-Apr 22 1 week - Determine interface requriments.
- Determine output requriments.
Apr 25-May 06 2 weeks - Design objects needed from requirments.
- Create wiki pages containing objcets, methods, members and algorithms.
May 09-Jun 03 4 weeks - Implement objects.
- Build the interface.
Jun 06-Jun 10 1 week - Test to ensure complete, correct product.
Specification
Goals
- Ability to overlay several raw spectra on the same screen
- Q:Where do the spectra come from? Single file? Seperate Files? What does the data look like.
- A: Spectra files are the files are the 'raw' data that comes from the machine, consisting of mass - intensity pairing in tab-delimeted form
- Ability to zoom in and out and see anything from the whole spectra to individual points
- Q:How do you zoom? With a mouse movement? A draw box perhaps? Will it show from top to bottom? Or can you show form mass 1 to mass 2 and intensity 1 to intensity 2? or is do you just zoom on the mass?
- A: There will be a 'zooming rectangle' that specifies what part of the full spectra is being shown; to zoom in, creating a rectangle with the mouse will suffice. To zoom out, either a left-mouse click, key event, or a button present on the image itself (such as the + or - sign in the mockup) will be used.
- Ability to overlay bin information along with spectra
- Q:Where does the bin information come from? An external file? What is the format of the bin info?
- A: Ultimately the bin information will be generated by some model that this view is connected to, but all that needs to be displayed by this view is the bin range as a rectangle, so a temporary scheme of reading in a 'validbins.txt' file outputted by the PSB method can be used.
- Ability to see transformed spectra in comparison to orignial (denoised, baseline corrected)
- Q:Where does this data come from? External file or files? Are you going to show this information for every spectra at once? or a signle specta?
- A: This will come from internal generation. There will be a list of all spectra and all sub-categories present in the spectra (ie baseline corrected, denoised), and the user will be able to select how many spectra they would like to see, and which parts of the spectra they would like to see.
- If denoising and baseline correction is supposed to be done internally this needs to be added as a requirement. This is a nontrivial aspect and needs to be noted.
- Ability to display selected peaks
- Q:What do you mean? How do you select a peak? What will be displayed? What is the goal of this ability?
- A: Peaks are selected after denoising, and are generally the local maxima of the denoised curve. Overlaying our selected peaks in relation to the baseline corrected curve can allow an investigator to see if the peak discovered is a 'true' peak, or what appears to just be a machine artifact, in which case the signal-to-noise ratio can be adjusted. Similarly, they can see if there exist what they believe to be true peaks dismissed by our method.
- Ability to highlight centroids of selected peaks
- Q:What is a centroid? What is the goal of this ability?
- A: To show the 'width' of the peak, may be redundant with the binning information
- If there is redundency, it needs to be resolved. We do not need to do anything that is not necessary. Or, if it is covered, make a note that this information needs to be displayed, but it is covored elsewhere.
- Ability to view data in clustering form
- Set/select/adjust relative "brightness" of highest peaks
- Q:Are you refering to the existing cluster ability?
- A: Yes, a slight modification to that, and an attempt to extend it to handle larger data that exists in raw spectra
- Q:Are you planing on exporting any of these sceens?
- A: Yes, via windows graphics objects
For future development consideration
- Ability to manually select peaks
- Ability to manually resize/change bins
- Ability to show/generate "the average spectra" of those selected
- Ability to push a vertical offset on to each spectra so that they can be shown without overlapping
Conceptual Mockup
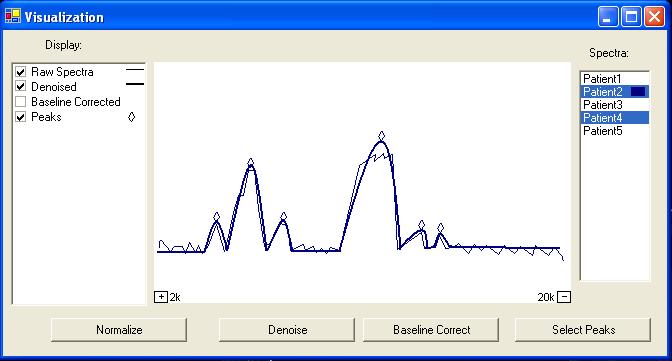 Note: Buttons only shown as an example. The actual data processing required to make them functional is outside the scope of this section.
Design
Classes
- Data
- SpectraData - Data representation of a spectra, and all pertinent information on it
- SpectraDataCollection - Collection of all spectra with information pertenent to the collection
- Graphical
- SpectraDisplay - Panel with adjustable parameters to display a SpectraDataCollection
- PlotChart - Minimal Panel for displaying a given set of points
To-Do list
- Interface to acess options
- Memory-map spectra-data
- Finalize/create visualization decisions for the various Displayable types
- What characteristics (dashed lines, heavier lines, lighter color) will let the user distinguish between a spectra's deniosed version from its baseline-corrected version?
- 'Default' zoom-out size
- Should zooming out find the largest intensity and mass-charge values and scale the whole image to that, or should zooming out just add X units to the mass values displayed and Y units to the intensity values every time?
- Draw in relative scale, or scale endpoints
- Select a size threshold, after which if the user zooms in any closer, individual points are drawn instead of lines
Edit | Attach | Print version | History: r12 < r11 < r10 < r9 | Backlinks | View wiki text | Edit wiki text | More topic actions
Topic revision: r12 - 10 Jun 2005, NimishGautam

Ideas, requests, problems regarding Vanderbilt Biostatistics Wiki? Send feedback