You are here: Vanderbilt Biostatistics Wiki>Main Web>Projects>MicroArrayMassSpec>Wfccm2Guide (15 Feb 2014, WikiGuest)EditAttach
WFCCM 2 How-To
Step-by-step
Step 1: Loading the Data and Information Sets
- Go to "File -> Add a Data Set" to add the given data
- The name of the Data Set will now appear on the left-hand column. Click on the name to select it, if it is not selected already.
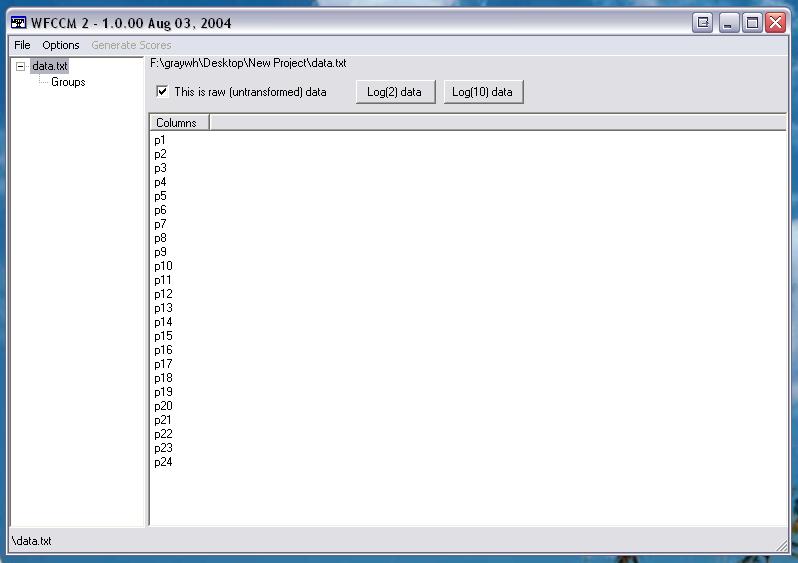
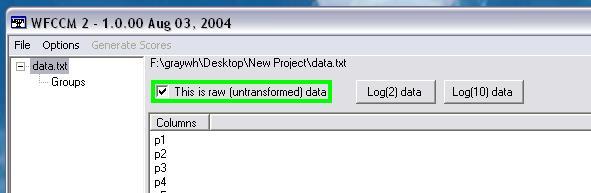
- There is a checkbox present above the data rows to indicate whether the data is logged or not. By default, the program assumes this is not logged data. If it is logged data, uncheck the box.
- The name of the Data Set will now appear on the left-hand column. Click on the name to select it, if it is not selected already.
- If an Information Set exists, go to "File -> Add Info Set"
- The column headers will now also contain information relating to the columns, such as descriptors for groups.
- If there is a file that has "_info" appended to the data set name, it will automatically load it as an info set. (Ex: data.txt, data_info.txt)
- Log the data (Assuming it is not)
- If a logged version of the data set already exists, simply go to "File -> Add Log Set to Data"
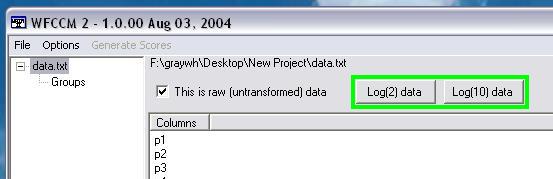
- If not, press one of the Log buttons to generate a logged version of the data set. Usually, Log 2 for MicroArray and Log10 for MassSpec.
Step 2: Create Groupings
- Click on the "Groups" tab underneath the data set name with which you are working.

- Select an Active Descriptor from the drop-down box. This descriptor will correspond with the column names shown in the information set. If no information set has been added, the only choice available will be "none".
- Select columns from the null group that you would like in group 1. Press the "To group 1" button to send them there. Do the same for group 2.
- Use the "Select columns of type" box to select all columns with the given descriptor. The columns can be rearranged as necessary between the null group, group 1 and group 2.
- Create a unique and descriptive name for the group in the "Grouping Name" box. By default, this will be the name of the active descriptor.
- Press "Create"
- You can now view and modify your grouping under the "Groups" tab of the data set. The group will continue to be modifyable until statistical tests (scores) are generated or applied to it.
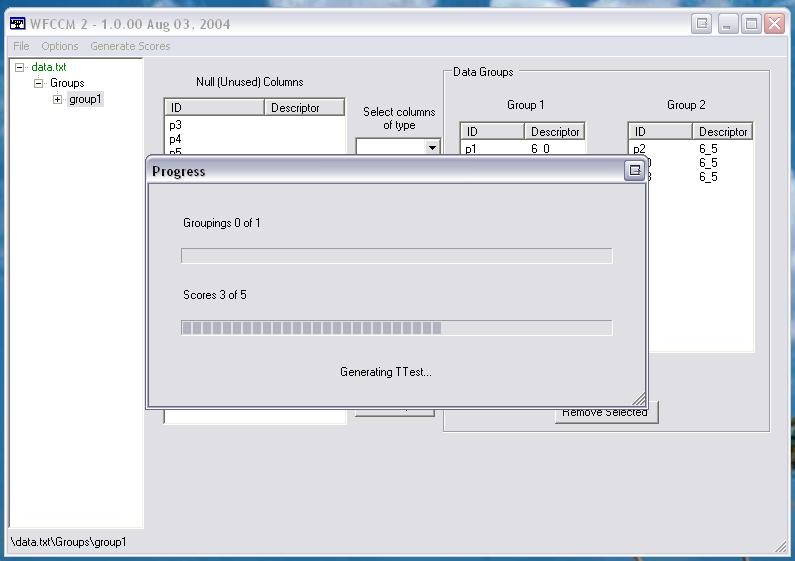
Step 3: Adding/Generating Scores
- Select the tab with the data set name, the tab labelled "Groups" or the tab with a grouping name.
- Selecting the tab with the grouping name will run scores just on the selected group. Selecting either other tab will run scores on all groups in the data set.
- Go to the "Generate Scores" menu option
- If any score names are unavailable, it is because of the availability of logged or unlogged data.
- Select Cross-Validation and the number of folds if desired. This option will greatly increase the computation time. This is for advanced users.
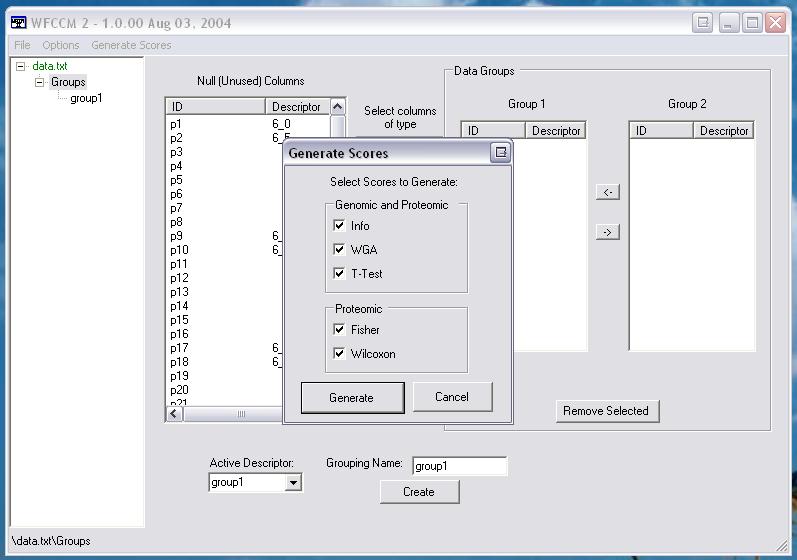
- Press "Generate"
- When the progress bar has completed, the scores will appear as an item under the grouping name labelled "Scores"
- If the "AutoSave Scores" option is checked under "Options -> AutoSave Scores", the scores will be saved in the working directory under the name " group name _scores"
- Add any additional scores that you may have, either from the "Add Score File" button or "File -> Add Score File"
-
 Scores from a file take precedence over scores generated if there is a conflict.
-
Step 4: Creating Criteria
- Select the tab labelled "Criteria"
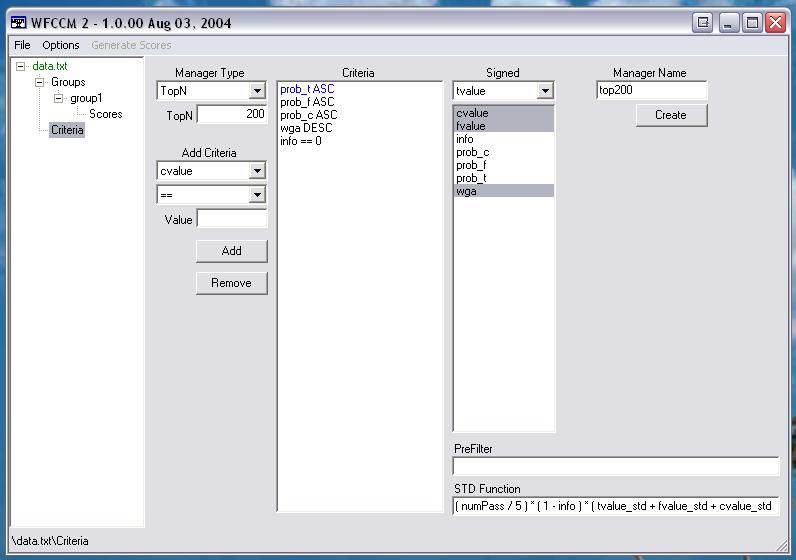
- Select what type of run you would like to do from the "Manager Type" dropdown box
- A TopN run will output the top n rows, running distance with the top 1 row, top 2 rows... upto N. The control is pre-loaded with the standard default top 200 run.
- A "Cutoff" run will create a Cutoff manager
- Modify Criteria
- Select a column name under "Add Criteria", the operator for it, and the value the operator will have. Ex: For "prob_t <= .05", you would select the "prob_t" name, the "<=" operator, and input ".05" for the value.
- Add the criteria with the "Add Criteria" Button
- Remove any criteria that you do not want by clicking on the unwanted criterion from the middle list, and pressing "Remove"
- Set the Sign changes
- Select the sign that you want to be the lead from the drop down menu labelled "Sign".
- Select the columns whose signs should follow the lead from the list below.
- Ex: Suppose you wanted all of the scores for "cvalue", "fvalue", "wga" and "asam" to have the same sign (positive or negative) as the "tvalue" for that observation. You would select "tvalue" from the drop down menu labelled "Sign". You would then select "asam", "wga", "fvalue" and "cvalue" from the list by highlighting them.
- Set Distance Permutations
- Set the number of distance permutations to run with the numerical up-down box.
- This will give your overall accuracy a p-value.
- Create a prefilter, if desired
- Enter a prefilter (a boolean expression) in to the "PreFilter" box. Scores will initially be filtered by what you specify here.
- Enter data percentage values in the numeric up-down box(es) if needed. This will overwrite any prefilter already entered.
- Ex: Suppose you only wanted to keep observations that had at least 70% of their values in group one and at least 60% of their values in group 2, OR an info score of zero. You would input "(pctgrp1 >= .7 && pctgrp2 >= .6) || info = 0"
- Create a standard function, if desired
- The function is generated automatically based on the criteria selected. This is only for advanced users.
- The function inputted here will be evaluated for every feature as the "userValue" and will evaluate like any other mathematical operation.
- To refer to a normalized ("standardized") value for a score, append "_std" to the name in the function.
- Ex: Suppose you wanted every row to calculate the number of criteria it passed, divide that number by two, then multipy by the normalized wga score for that observation. You would input
" (numPass / 2) * wga_std "
.
- In the box labelled "Manager Name", select an appropriately descriptive name for the set of criteria you have created, and press the "Create" button.
- The newly created criteria manager is now visible under the "Criteria" tab and is editable, similar to the groups.
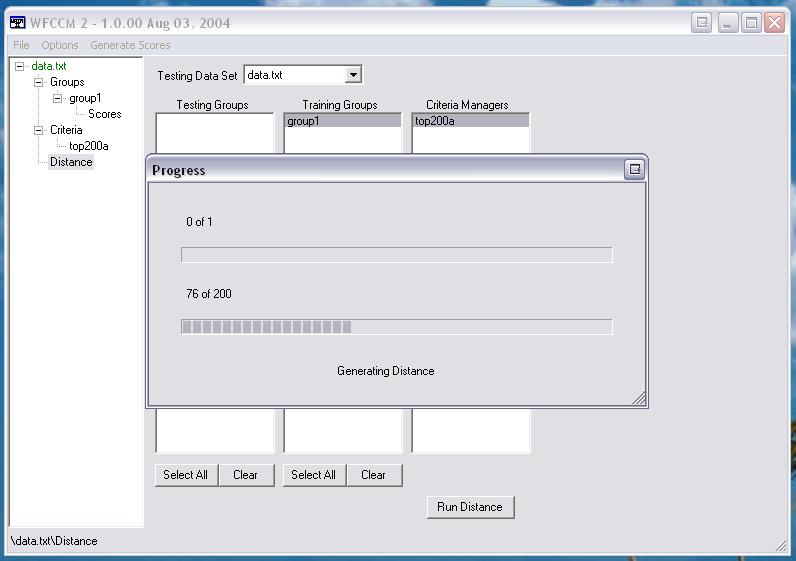
Step 5: Running Distance
- Select the tab labelled "Distace"

- Select the testing group(s) by name, if they exist, from the box labelled "Testing Groups".
- If the testing grouping is a grouping from the existing data set, create the grouping if it has not yet been created
- If the testing group exsists in another data set, load the testing data set into the system and create the the testing group for this data set.
- From the Distance panel, select the name of the data set that contains the testing group. The group names from that data set will now appear in the box labelled "Testing Groups"
- Select the training group(s) by name from the box labelled "Training Groups".
- Select the Criteria Manager that you would like to apply for this distance run.
- Press "Run Distance"
- The distance reports will be saved inside the working directory, under a folder named criteria manager name_grouping name.
- If multiple training groups and multiple testing groups have been specified, training and testing pairs will be assumed based on name. So, if you have a training group named "colon_cancer", the corresponding testing group should also be named "colon_cancer".
Additional Features
Loading/Saving States
- A state maintains data grouping information, criteria, scores, and references to data sets.
- A state can be loaded or saved at any time by going to "File -> Load Saved State" or "File -> Save State"
- Loading a state means the criteria managers and data groupings you are working on will be lost unless you have saved the current state first.
- Since saved states do not actually contain data, loading a saved state after your data has been moved to another folder (or if your data is on another computer) will result in an error when trying to run scores or calculate distances.
Averaging by patient or column
- After adding a data set and and information set, click on the name of the data set.
- On the horizontal bar above the data set information, there is a box labelled "Average by". This lets you select a column name to average by.
- These are the names from the information set. Selecting one will automatically create an averaged set, which you are asked to save.
- The program averages by values in the column. Ex: Suppose your information set looked like the one shown below. Selecting "Average by Patient" would produce a new data set, one with columns labelled "p1" and "p2", each column being the average of the component columns, as illustrated below:
| column | patient |
|---|---|
| c1 | p1 |
| c2 | p1 |
| c3 | p2 |
| c4 | p2 |

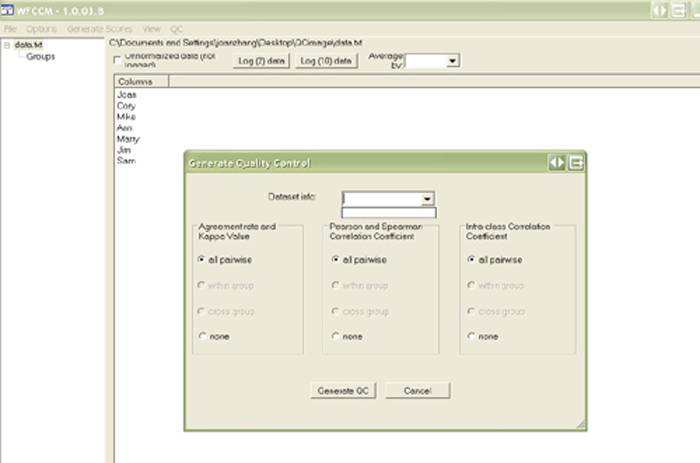
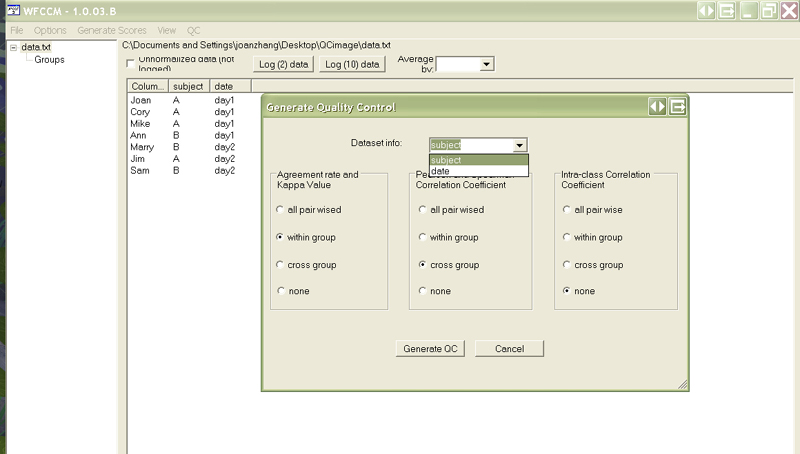
Quality Control
- By default, the QC label is disabled, it only enabled if the unnormalized data(not logged) is unchecked, or if the Log buttons is clicked. Usually, click Log10 since QC is MassSpec data only.
- The column headers will show in the panel; if the information set is loaded, then clinical information show up in this panel also.

- Click QC label, the QC dialog shows up. QC includes 3 methods,Frequency(agreement rate, kappa value), Correlation Coefficient(Pearson, Spearman), and Intra-class Correlation Coefficient.
- "within group" and "cross group" buttons are disabled if none of information set loaded
- "within group" and "cross group" buttons will be enabled once information set is loaded AND an Active Descriptor is selected from drop-down box
-
- Button all pairwise -- by default, QC calculates all pairs of a data set, in this example, all pair wised button returns pair wised result of Joan, Ann, Marry, and Jim since user have highlighted this columns. If none of columns highlighted, it calculates all 7 columns in this case.
- Button within Group and cross group -- within group gives QC results of within each descriptor, in this case, it returns 2 sets of result, one if result of subject A, and the other one is subject B. cross group returns QC results of each column of one descriptor to all other columns of another descriptor.
- Button none -- none of analysis required.
- the output files name as these

Definitions
Data Sets
- A logged data set is a data set whose values should be interpreted as the log base 10 or log base 2 of some original values.
- A raw data set is a data set whose values have not been transformed.
- Data format must adhere to the guidelines.
Information Set
- An information set is a mapping of column names to attributes, as defined in the guidelines.
Cutoff Criteria Manager
- A cutoff criteria manager holds criteria that behave similar to filtering with the following exception: multiple values can be stored for a criteria, and each one will be looped through.
- Ex: Suppose you had the following criteria "prob_t > .05, prob_t > .01, info
= 0". There would be 2 runs, the first run would use "prob_t > .05, info =0 " and the second would use "prob_t > .01, info == 0"
TopN Criteria Manager
- A topN criteria manager determines the top n observations, with the ranks being generated based on supplied criteria.
- In the event of a tie, the first criterion entered will be used to break the tie. This criterion will be shown in blue.
- ALLOWTOPICCHANGE = SharedResourceGroup
Edit | Attach | Print version | History: r16 < r15 < r14 < r13 | Backlinks | View wiki text | Edit wiki text | More topic actions
Topic revision: r16 - 15 Feb 2014, WikiGuest

Ideas, requests, problems regarding Vanderbilt Biostatistics Wiki? Send feedback