You are here: Vanderbilt Biostatistics Wiki>Main Web>Projects>MicroArrayMassSpec>WfccmNotes>WfccmWebVisualTool>WebVisualizationUserManual (10 Apr 2006, HaojieWu)EditAttach
Web Visualization User Manual
The following sections hope to provide enough information to setup a user new to our web visualization tools for accessing his data analysis results through browser.
Getting started
Browser and Web Site
- Mozilla Firefox 1.5.0 is recommended.
- The login web site is http://160.129.18.136/webviz/.
Open an account
- Please contact Biostatistics Shared Resource to open an account for you. Please provide your email address in case you forget your password.
- You will get a user name and a password.
About password
- Change password
- Get on the Login web site.
- Login with your user name and password.
- Click [Change Password] on the right.
- Submit your new password.
- Forget password
- Get on the Login web site.
- Click [Forgot Password?].
- Enter your user name.
- An email with new password will be sent to you.
Step by Step
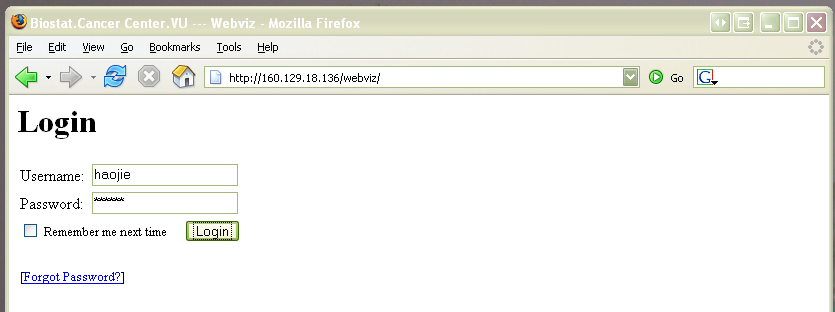
Step 1 : Login with user name and password
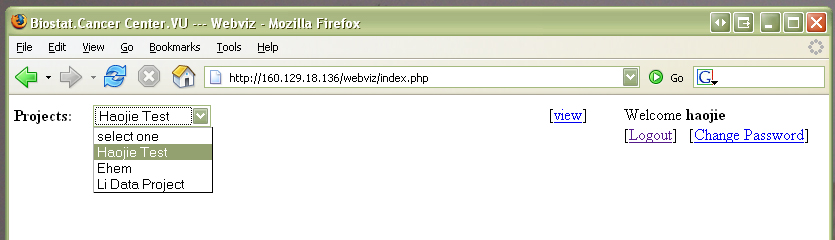
Step 2 : Select one project from the projects pull list
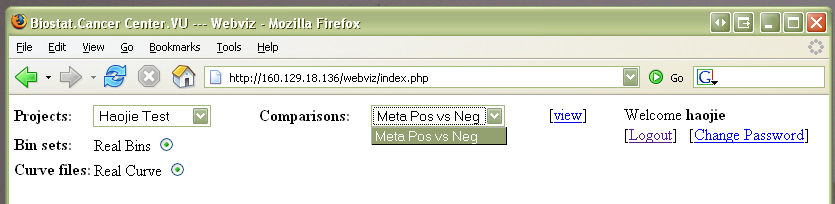
Step 3 : Select one comparison from the comparisons pull list
Step 4 : Get the graph
- Check the "Bin sets" and "Curve files" you want to view
- Click the [view]
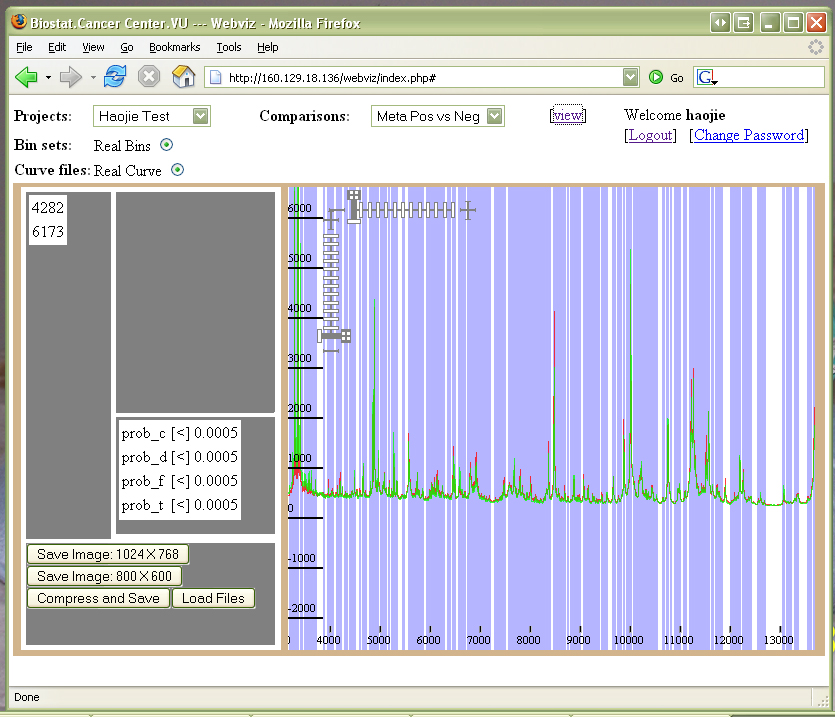
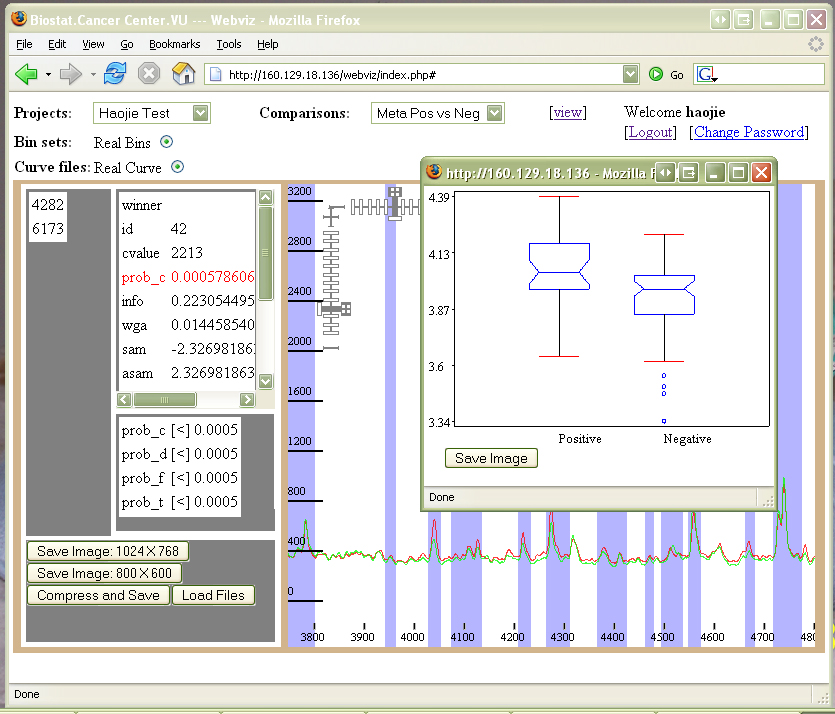
Step 5 : Play with it
- Panels
- Image Window (right)
- Winner List (left 1)
- Bin Score (left 2)
- Criteria (left 3)
- Save and Load (left 4)
- Features
- Zoom in and zoom out with slider bar.
- Grab and move with your mouse.
- Double click the bin rectangle, the associated scores is show.
- Click the winner name, the boxplot pop up. Click button to save it.
- Save a image in 1024X768 or 800X600.
- Compress and save, then download files.
Edit | Attach | Print version | History: r2 < r1 | Backlinks | View wiki text | Edit wiki text | More topic actions
Topic revision: r2 - 10 Apr 2006, HaojieWu

Ideas, requests, problems regarding Vanderbilt Biostatistics Wiki? Send feedback