You are here: Vanderbilt Biostatistics Wiki>Main Web>TWikiUsers>ChunLi>SNPChipCoverage (revision 23)EditAttach
Coverage maps of SNP chips and their coverage variation across genome
Genome-wide association (GWA) studies rely on commercial SNP genotyping panels, for which a common evaluation criterion has been the global coverage of the genome. However, the level of variation in coverage is also important for evaluation of SNP chips. Here, we provide a detailed coverage map for currently available SNP chips.Coverage map
This coverage map (Supplementary Figure 1 of our paper, gzipped version, 6.05MB) contains a detailed, high-resolution graph of the local coverage rate of four commercial SNP chips: Affymetrix SNP Array 5.0 (in black) and 6.0 (blue), and Illumina HumanHap300 (red), HumanHap550 (green), HumanHap650Y (cyan), and Human1M (purple). The red bars at the top and bottom indicate the transcription regions of known protein coding genes (based on the knownGene table obtained from the UCSC human genome release hg17) The variation of coverage for the five SNP chips (global coverage shown as dotted lines):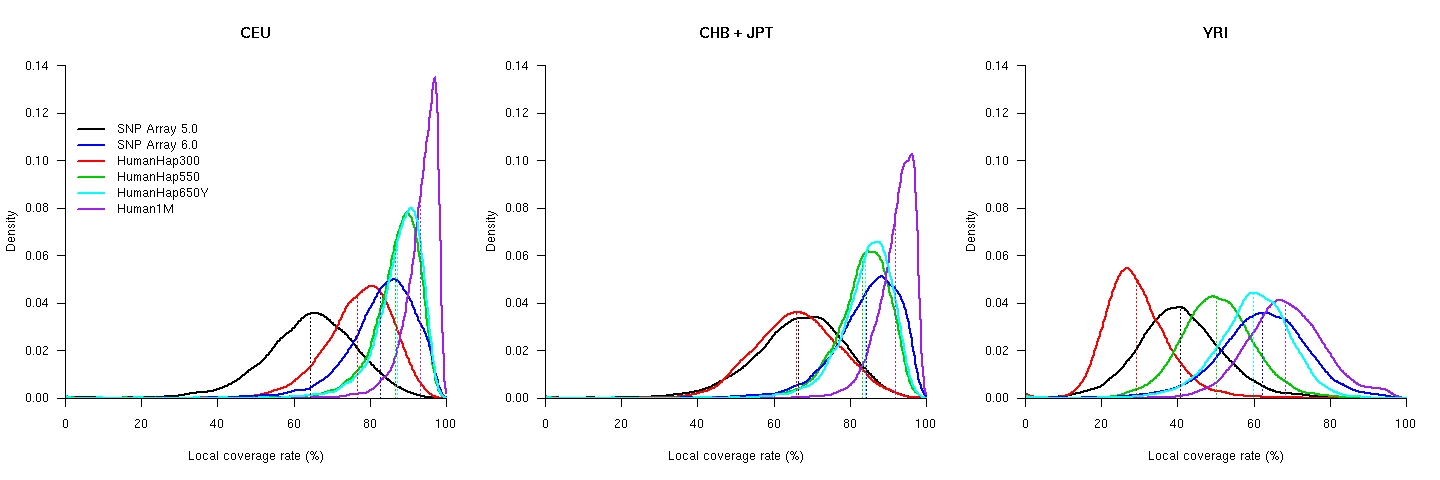 Raw data for local coverage: CEU, CHB, JPT, YRI. The explanations of the columns are here.
Coverage of known genes
The variation of coverage for known genes with ≥5 HapMap common SNPs in between the transcriptional start and end positions: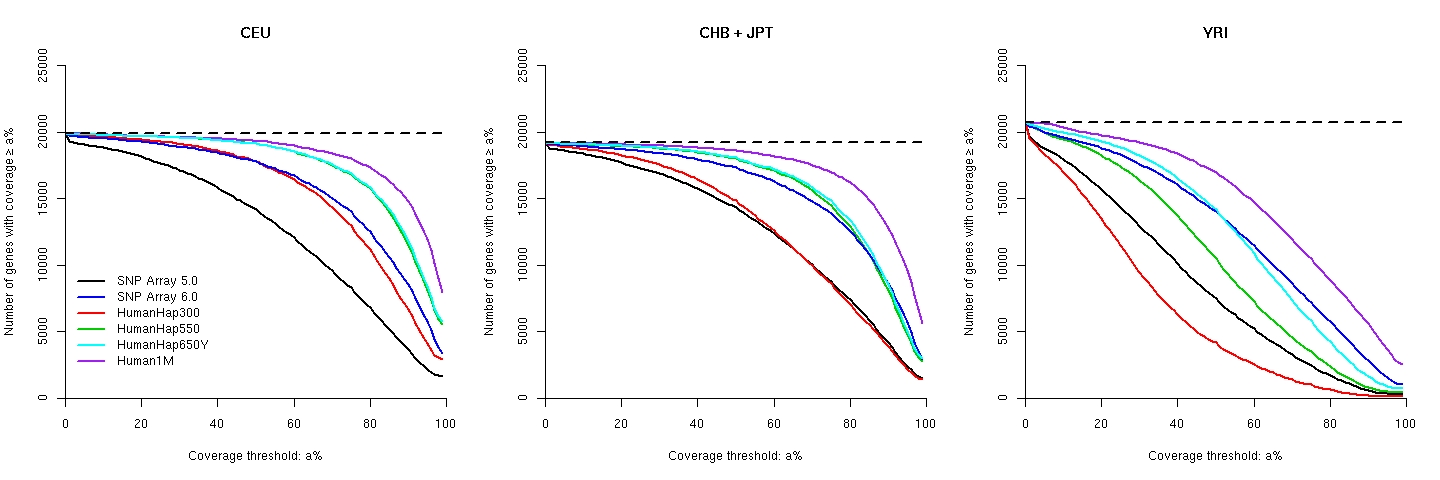 Supplementary Table 1 of our paper for gene coverage: CEU, CHB, JPT, YRI. The explanations of the columns are here.
Methodology
For each region, we use the formula of Barrett and Cardon (Nat Genet 2006;38: 659-662) to estimate coverage rate: [L / (R T) × (G T) + T] / G, where- R: The number of common SNPs in the HapMap
- T: The number of common SNPs on the SNP chip
- L: The number of common SNPs not on the SNP chip but are tagged at r2≥.8 by at least one SNP in the chip within 250 kb
- G: The total number of common SNPs in the region, including those that have already been discovered and those that have yet to be discovered. For a 1 Mb region, the average number of common SNPs is estimated to be about 2,631 based on the estimated numbers of common SNPs (7.5×10⁶) [Barrett and Cardon 2006] and euchromatic base pairs (2.85×10⁹) in the human genome.
- Note: We recognize that different estimates of G may lead to different values of local coverage rate. However, the above formula can be rewritten as L / (R T) + [1 L / (R T)] × T / G, which indicates that the value of G has little effect on the final estimate as long as the fraction of common SNPs included in the SNP panel, T / G, is small, which is true for the five SNP chips we evaluated.
Associated paper
Li M, Li C, Guan W (2007) Evaluation of coverage variation of SNP chips for genome-wide association studies. European Journal of Human Genetics (in press)Other papers of relevance
- Cost efficiency of SNP chips: Comparison of cost efficiency of SNP chips
- GWAsimulator: A rapid whole genome simulation program
Topic revision: r23 - 21 Dec 2007, ChunLi

Ideas, requests, problems regarding Vanderbilt Biostatistics Wiki? Send feedback