You are here: Vanderbilt Biostatistics Wiki>Main Web>TWikiUsers>JeffreyHorner>RapacheNotes>RapacheWebServicesReport (24 Apr 2009, JeffreyHorner)EditAttach
Using Rapache for Web Services
R is fast becoming the language of choice for statistical computing, and researchers are quickly transferring their cutting edge research to R's Comprehensive Package Network (CRAN http://cran.r-project.org/). To take advantage of this, software architects must decide how they can leverage this research in an effective and manageable way, both for their existing software systems and their future software systems. Leveraging R ranges from having researchers run statistical models with R on their desktop against data extracted from data warehouses to integrating R as a component in a larger software system. Further, software components can be tightly or loosely coupled. Dynamically linking a library of linear algebra functions to a C program can be thought of as tight coupling, while a client program exchanging messages with a server program can be thought of as loose coupling.1. Introduction
This report describes how REDcap1 project leveraged R's plotting and statistics facilities with web services using the Rapache2 project. Section 2 briefly describes the web application and its need for R. Section 3 describes potential R projects that were available to solve the task. Section 4 describes the solution with Rapache and web services. Section 5 discusses future work and Section 6 contains concluding remarks.2. Existing Web Application
The REDCap web application is a data capture tool for clinical and translational research created at Vanderbilt. It is implemented in PHP and Javascript with data captured in a MySQL database. Typical usage involves clinicians entering patient demographics and per-study measurements over a period of time. At the conclusion of a clinical study, the clinician downloads the data from the web application and analysis commences. The informaticists working on REDCap were searching for a way to add mid-study tools to ensure data integrity. For instance, a clinician may have miss-typed a blood pressure reading or weight measurement. Finding such a problem at the end of the study rather than near the time it was entered could hinder data analysis. The solution was to provide plots and simple statistics of each clinical variable while the study was in progress. That way, the clinicians could frequently monitor the variables for any problems. A first attempt involved using JpGraph3, a PHP graph creating library, but proved too cumbersome to implement. After preliminary research using the plotting capabilities in R, the informaticist was convinced that a solution would be found using R. The informaticist borrows server space for the application from another researcher and is reluctant to lean too heavily on his goodwill to install R software or place additional stress on the server. Thus, leveraging another server with R installed was in the informaticist's best interest. The questions were how to communicate with R on the new server, could the communication link be fully secured, and would a solution perform well?3. Projects for Utilizing R in a Network/Web Application
Rserve
Rserve4 is a fork-on-demand server written in C with a custom binary protocol layered on top of TCP/IP. Client systems communicate with Rserve by implementing the Rserve client API, and the Rserve distribution contains Java, C++, and R client implementations. When a client connects to Rserve, the server forks a new server process, and the client deals directly with the new server process for the duration of the connection. Once the client closes the connection, the process exits. The Rserve client API provides all necessary functions for using many of R's facilities: sending and receiving variables to/from the R server process with automatic data marshalling, sending text in the form of R code to be evaluated in the server process, and receiving files such as R binary data files and R plot output files. The benefits of using Rserve are scalability and time reduction in starting a new R process (forking a process takes less time than start R from scratch). Rserve is actively maintained by the original author and is utilized by a handful of current Java projects . Unfortunately for the web application in this report, there are no PHP implementations of the Rserve client API. In addition, while Rserve provides client/server authentication mechanisms, there are no mechanisms for encrypting the communications.RSOAP
RSOAP5 is a fork-on-demand server written in the Python scripting language. It relies on the Rpy project to interface Python with R. Clients communicate with an RSOAP server via the Simple Object Access Protocol, a protocol that encodes structured data in XML messages. When a client initiates a connection to an RSOAP server, the server returns a new network port on the same server to which the client must then connect. The client disconnects from the RSOAP server and re-connects to the new server process on the new port. The client then sends all SOAP encoded messages to the new server. RSOAP may be beneficial for those who are interested in communicating via the SOAP protocol, however it is unclear if the project is still actively maintained. In it's current state, no authentication methods exist and there are issues with managing server processes abandoned by clients that forget to shut down the server connection properly.CGI Scripts
Common Gateway Interface (CGI) scripts exist that utilize R in some way. CGI is a specification that defines how HTTP request information is passed from the web server to the CGI script, essentially using environment variables. Some CGI scripts are written in Perl: Rcgi6, R-Online7, CGIwithR8, and Rweb9. Others are written in PHP: R_PHP_Online10 and R-php11. CGI scripts presume the presence of a web server to spawn the scripts, which leads to two notable benefits: authentication support and end-to-end encryption support with SSL. Unfortunately, spawning (i.e. forking a web server process and executing the CGI script in its place) takes time, and starting R takes even a bit more time. With Rserve, a client keeps a connection open to an Rserve process running R for the duration of time the client deems necessary. Many client/server exchanges may occur with no noticeable performance penalty. With a CGI script, the client connects, a new R session is spawned by the CGI script, the data exchange occurs, and then the R session closes. If the client must accomplish a task over multiple requests to the CGI script, performance can suffer. Most CGI scripts are out-dated and no longer maintained. In addition, they were created as a web application environment without consideration for web services. One way to speed up CGI scripts is to rewrite the scripts implementing the FastCGI12 protocol. This essentialy keeps each CGI script running permanently in a loop. When a web request arrives, the web server forwards it on to a FastCGI instance instance. Another way is to embed the scripting language into the web server as is the case with mod_perl and PHP. However in both cases, R still must be started and stopped upon each web request/response.4. Rapache and Web Services
Rapache embeds the R interpreter inside the Apache 2 web server. By doing this, Rapache realizes the full potential of R and its facilities over the web. R programmers configure appache by mapping Universal Resource Locaters (URL's) to either R scripts or R functions. The R code relies on CGI variables to read a client request and R's input/output facilities to write the response. One advantage to Rapache's architecture is robust multi-process management by Apache. In contrast to Rserve and RSOAP, Rapache is a pre-fork server utilizing HTTP as the communications protocol. Another advantage is a clear separation, a loose coupling, of R code from client code. With Rserve and RSOAP, the client must send data and R commands to be executed on the server. With Rapache the only client requirements are the ability to communicate via HTTP. Additionally, Rapache gains significant authentication, authorization, and encryption mechanism by virtue of being embedded in Apache.Solution
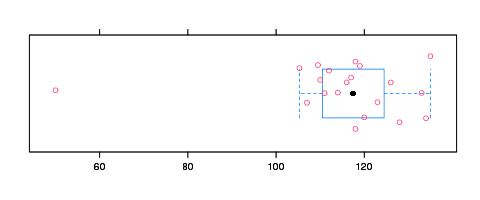
A web request is simply defined as a human clicking on a link in a web browser which communicates via HTTP to a web server; the web response is a new HTML web page displayed in the browser. A web service is very similar, however the request may or may not be initiated by a human and the response may result in data other than an HTML web page. For REDCap, a statistical server was installed with Rapache to provide two web services. One would provide a boxplot graphic in PNG format, given a particular variable under study. Another would provide simple statistics for a collection of variables under study. The web application would communication with the web services using the PHP curl module, a rich collection of functions for making HTTP requests. For complete security between the web application server and the statistical server, HTTP Basic authentication and SSL was employed, both supported by the curl module. The web services accepted character separated value (CSV) encoded data in the HTTP POST payload. Each variable was encoded this way with a line-ending character denoting the end of data marker. The first six elements of each line contained information that defined the variable completely: element one contained the short variable name, element two contained the long variable name, element three contained the web application validation type, element four contained the variable type, element five contained the enumeration data (e.g. categorical levels), and element 6 contained the number of observations. All remaining elements on the line were the observed values. Below is an example HTTP POST payload with one variable (the double quotes and the line end character after the string "118" are not part of the payload):"sbp_bl|Systolic Blood Pressure|float|text||22|126|133|117|110|118 |107|135|50|134|112|128|116|111|123|105.3|109.5|118|114|119|120"and it's corresponding table summary:
| short name | sbp_bl |
| long name | Systolic Blood Pressure |
| validation type | float |
| variable type | text |
| enumeration | empty (not a categorical variable) |
| number of observations | 22 |
| data values | 126, 133, 117, 110, 118, 107, 135, 50, 134, 112, 128, 116, 111, 123, 105.3, 109.5, 118, 114, 119, 120 |
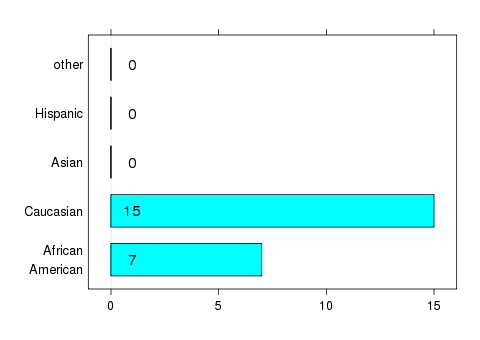
 Here is another example HTTP POST payload using a categorical variable (note that the string "\n" contains the literal characters '\' and 'n' and does not expand to the ASCII newline character):
"race|Race||select|
0, African American \n 1, Caucasian \n 2, Asian \n 3, Hispanic \n 4, other|
22|1|0|0|1|0|1|1|1|1|1|1|1|1|1|1|0|1|0|0|1|0|1"
it's corresponding table summary:
| short name | race |
| long name | Race |
| validation type | empty, we'll validate as categorical |
| enumeration | 0==African American, 1==Caucasian, 2==Asian ,3=Hispanic and 4==other |
| number of observations | 22 |
| data values | 1,0,0,1,0,1,1,1,1,1,1,1,1,1,1,0,1,0,0,1,0,1 |
 The simple statistics web service
accepted a collection of variables as input and returned CSV data on
output, one line per variable. Each line contained the following ordered
elements: element one contained the number of missing observations,
element two contained the minimum observed variable, element three
contained the maximum observed variable, element four contained the
variable mean, element five contained the variable median, and element
six contained the variable standard deviation.
The simple statistics web service
accepted a collection of variables as input and returned CSV data on
output, one line per variable. Each line contained the following ordered
elements: element one contained the number of missing observations,
element two contained the minimum observed variable, element three
contained the maximum observed variable, element four contained the
variable mean, element five contained the variable median, and element
six contained the variable standard deviation.
5. Discussion And Future Work
Anecdotal evidence suggests that the solution works. The web application users are pleased with the added plots and descriptive statistics and none complain of performance issues. In fact, the REDCAP project leader is keen on adding new web services to provide additional plots and analyses. One point to consider is the CSV input variable encoding to the web services. Note that missing data and their observation order are not encoded. These data will need to be encoded in order for new web services to be written that produce multivariate plots. One benefit of the current CSV input variable encoding is the support for de-identifying sensitive data. Since there are no ordering information, an untrusted source cannot infer too much about the variable if indeed the observations were randomized. Future work will involve re-engineering the CSV input variable encoding to support new web services that will deliver multivariate plots and analyses. Also, concise download-able study reports in PDF format are in the works as well.6. Conclusion
This report described how an existing web application leveraged R's plotting and statistics facilities with web services using the Rapache project. Also provided was a simple survey of alternative projects for leveraging R in a network/web environment.| [1] | |
| [2] | |
| [3] | |
| [4] | |
| [5] | |
| [6] | |
| [7] | |
| [8] | |
| [9] | |
| [10] | |
| [11] | |
| [12] |
Edit | Attach | Print version | History: r13 < r12 < r11 < r10 | Backlinks | View wiki text | Edit wiki text | More topic actions
Topic revision: r13 - 24 Apr 2009, JeffreyHorner

Ideas, requests, problems regarding Vanderbilt Biostatistics Wiki? Send feedback