You are here: Vanderbilt Biostatistics Wiki>Main Web>DiffGraphics (19 Aug 2006, JeffreyHorner)EditAttach
Lag Difference and Residual Graphics for Spatial Time Series
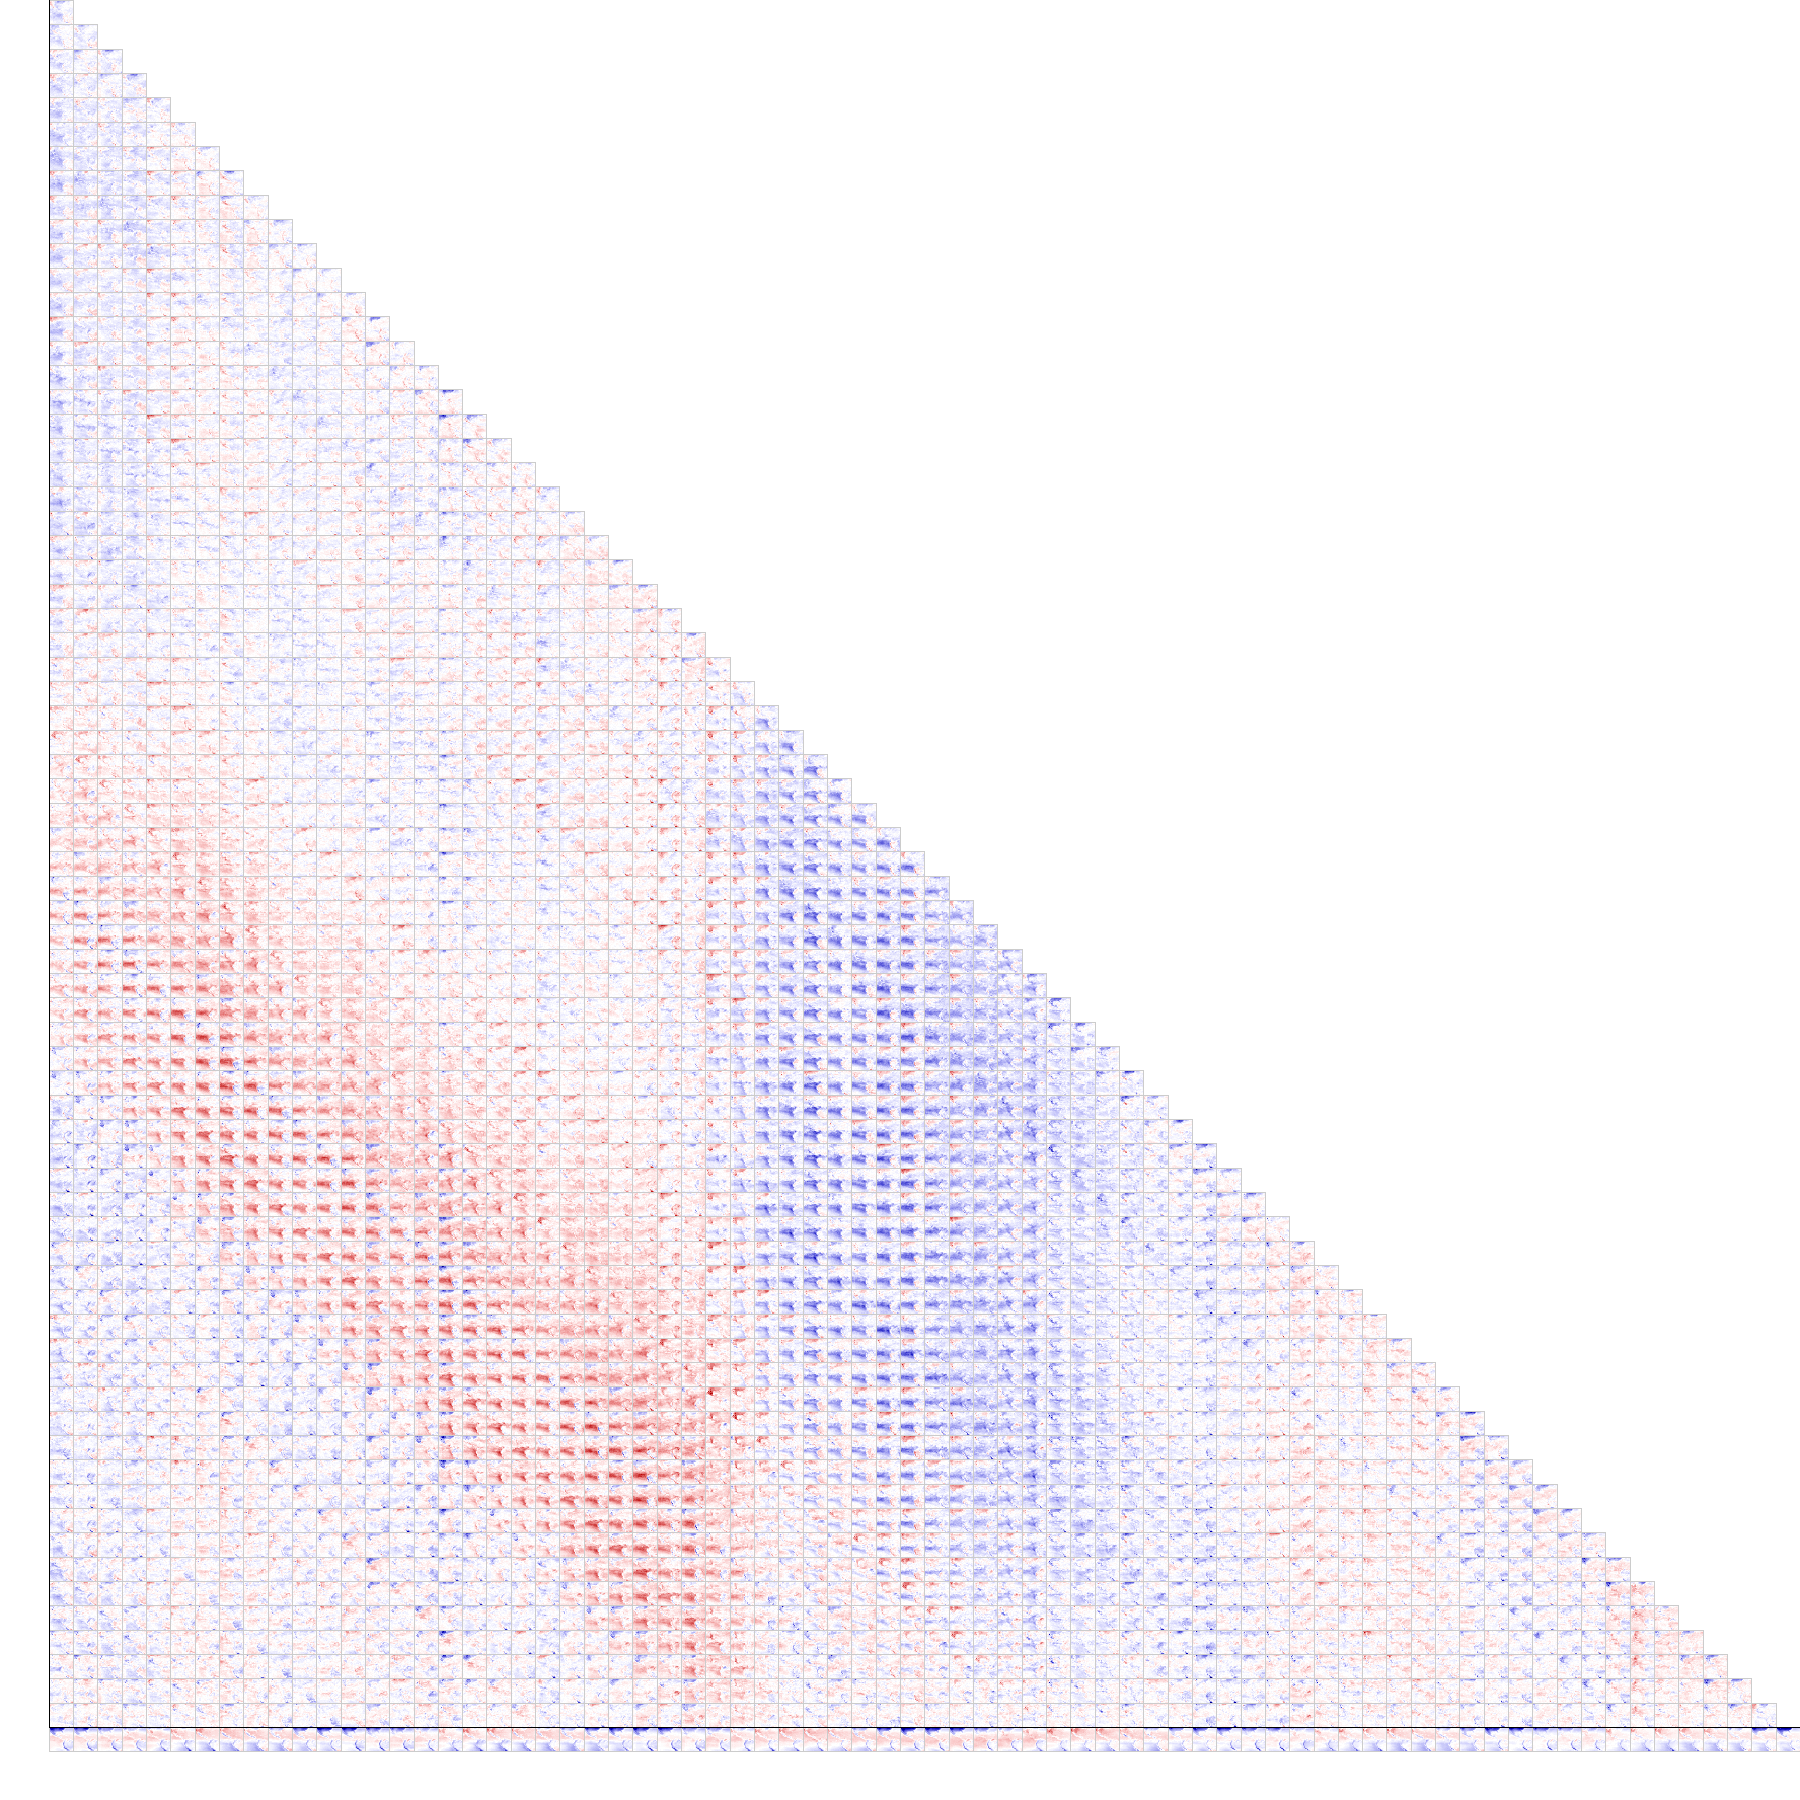
The following are graphics that went into making our poster handout for the JSM 2006 Data Expo. For this page, they are scaled to 600x600 pixels (view them in a separate window to see them full-size). Here's a link to the poster itself (150dpi). More to come as time and attention permit... You may be interested in Jeffrey's notes on the RGB color space.- Air Pressure Difference Graphic at 3in and 600dpi:

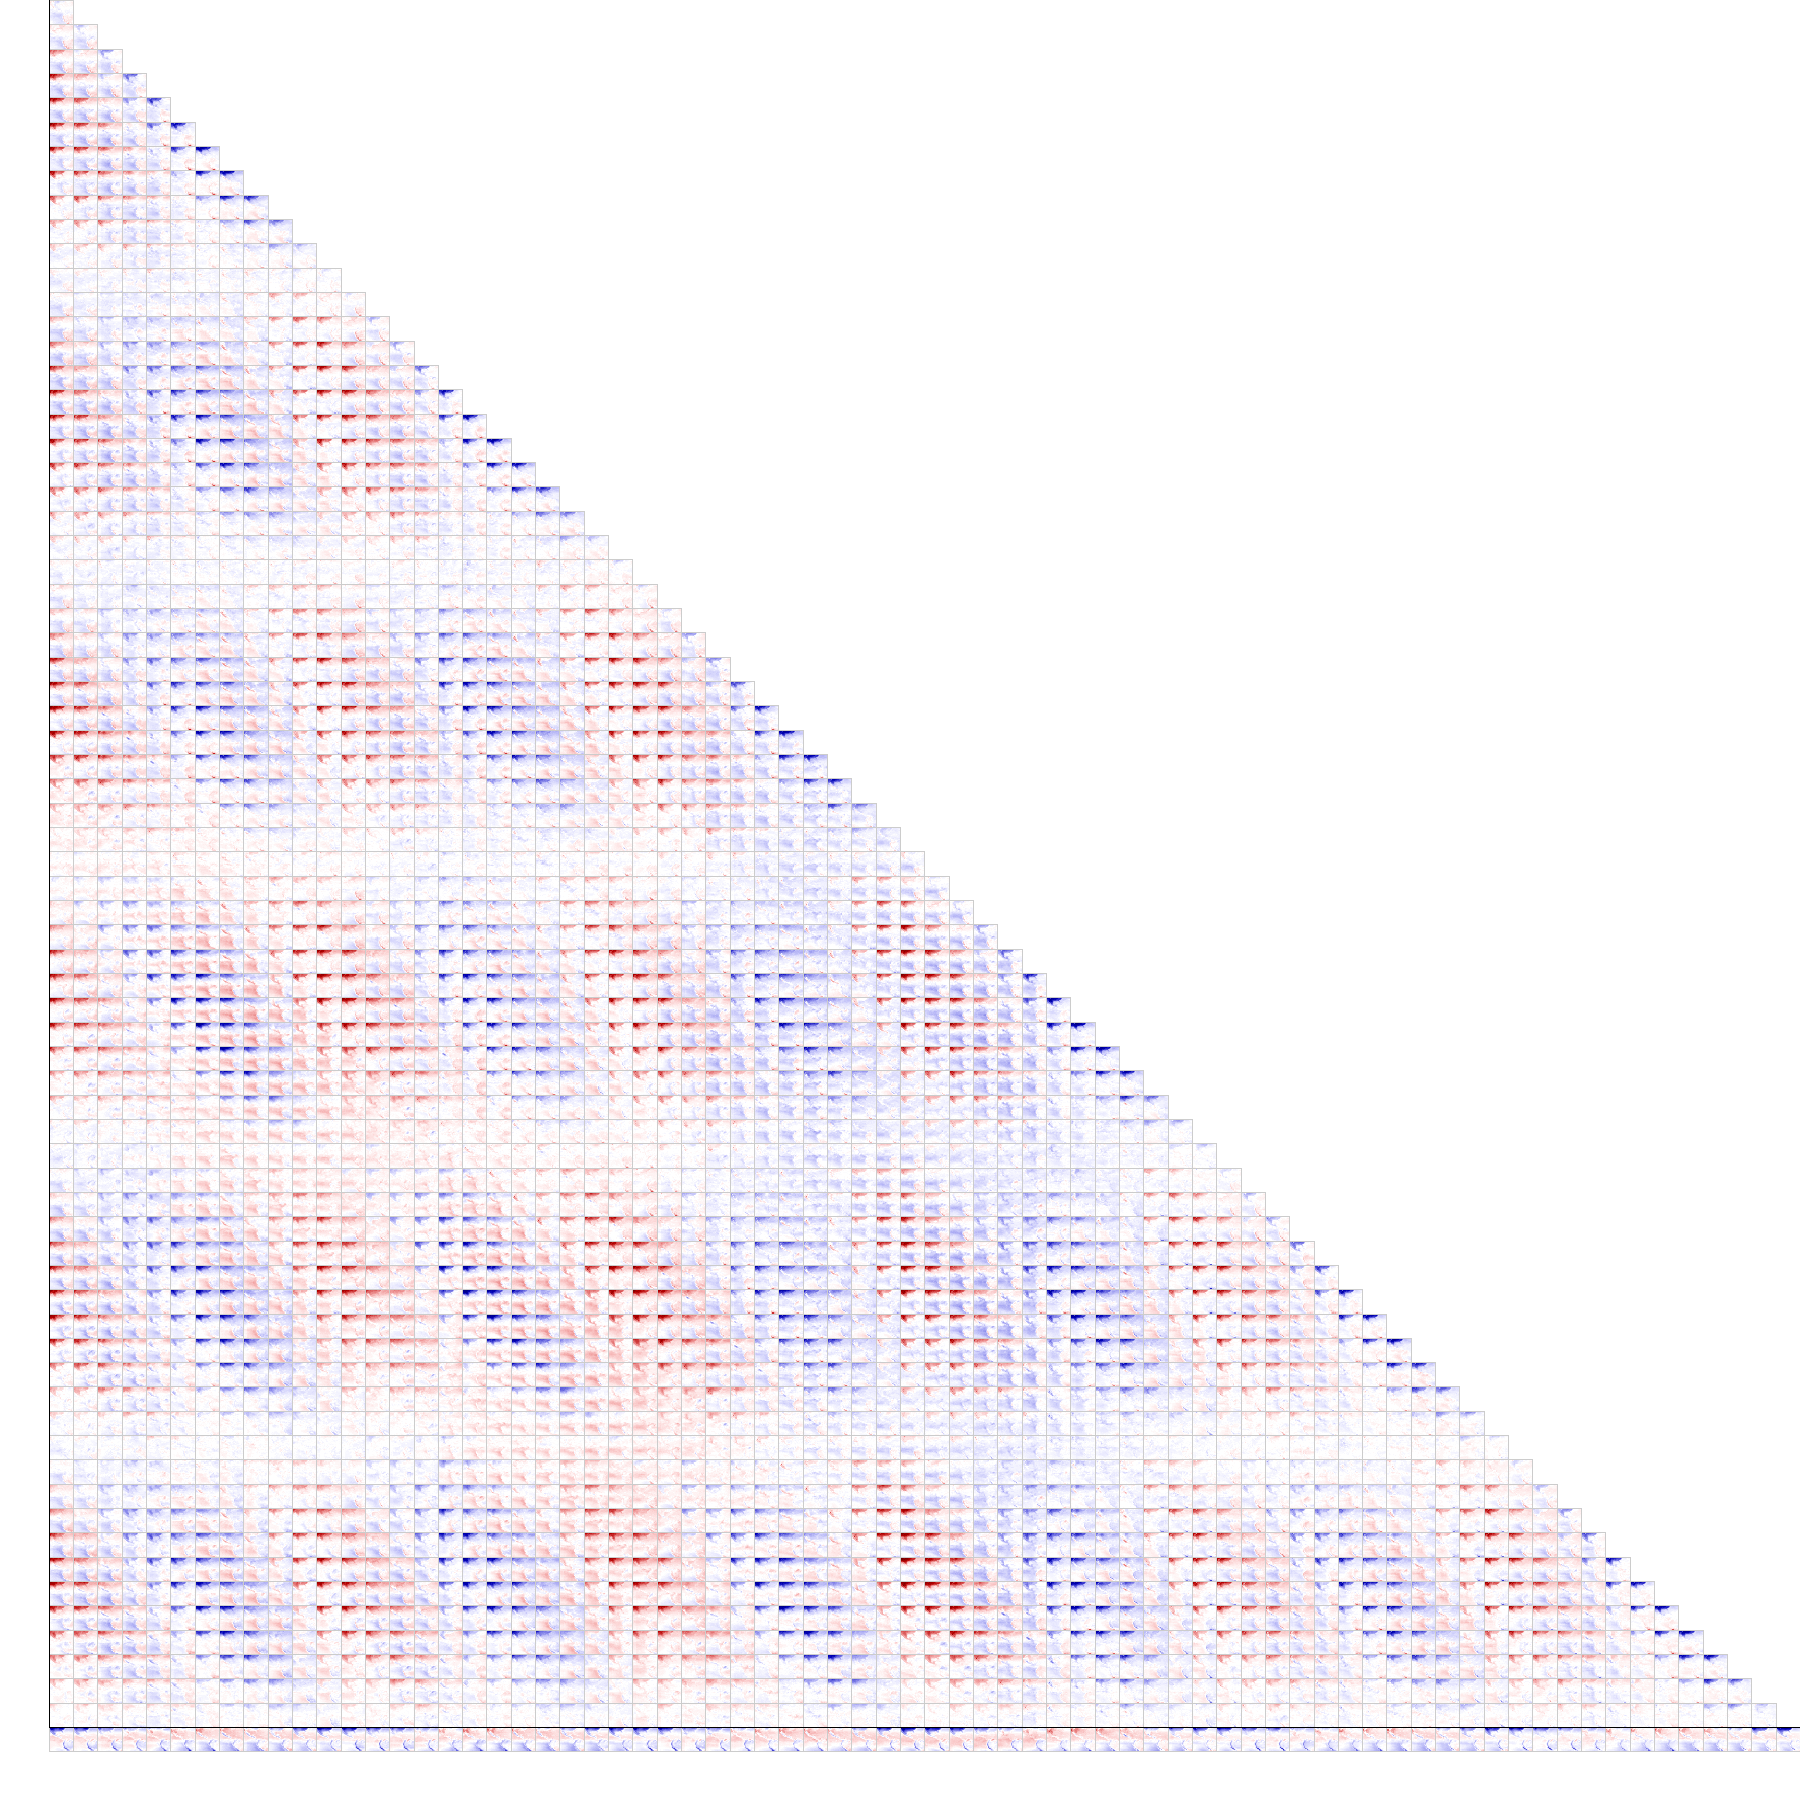
- Air Pressure Residual Graphic at 3in and 600dpi:

- Surface Temperature Difference Graphic at 3in 600dpi:
- Surface Temperature Residual Graphic at 3in 600dpi: