You are here: Vanderbilt Biostatistics Wiki>Main Web>Clinics>ClinicOmics>ComplexDataJournalClub (revision 4)EditAttach
Journal Club for Analysis of Complex Datasets
Sebastiani et al, Nature Genetics 37:435;2005: Genetic dissection and prognostic modeling of overt stroke in sickle cell anemia.
- Full Text | Commentary | Supplemental Information
- 18 Apr 2006, noon-1pm, Room D-2221 Med Ctr North, RSVP to biostat@vanderbilt.edu
- Discussed by FrankHarrell and ConstantinAliferis
Goals and Data
Pattern Recognition using Bayesian Network
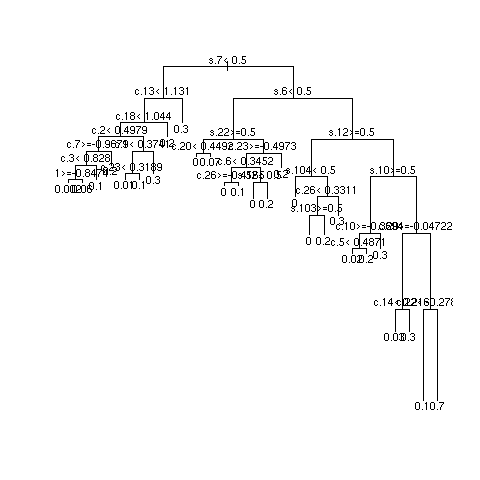
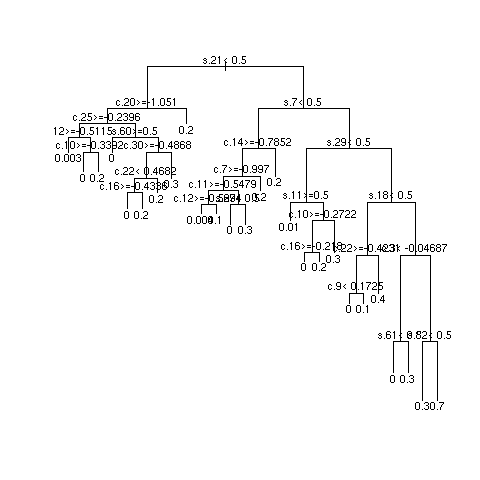
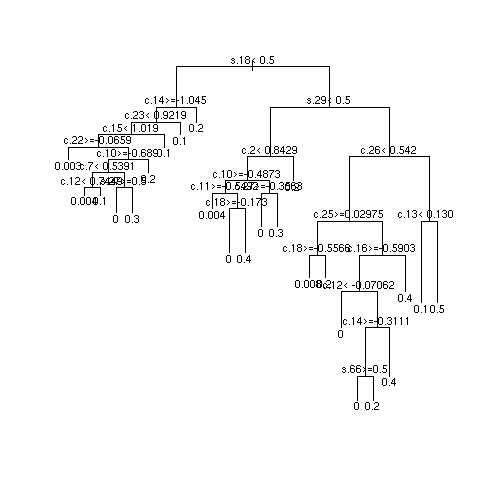
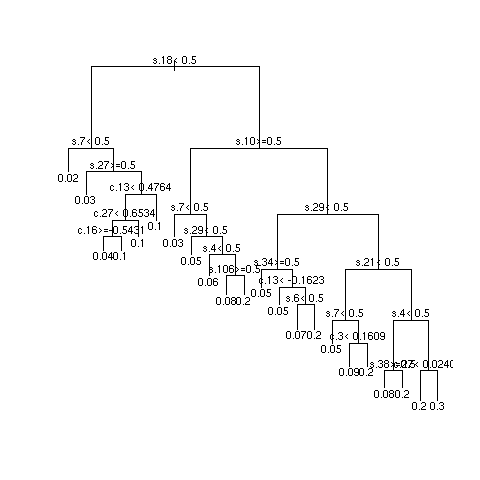
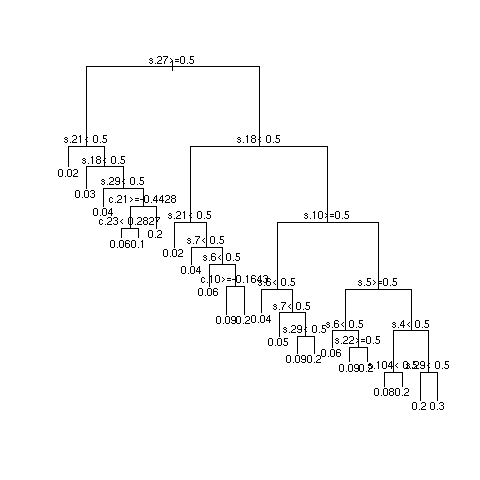
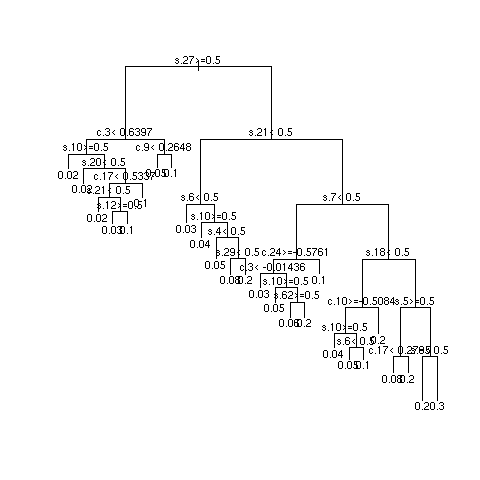
- Similar to recursive partitioning
- Example simulations showing instability
- Simulated data from additive logistic model with sample size of 1490 patients having a target of 92 strokes
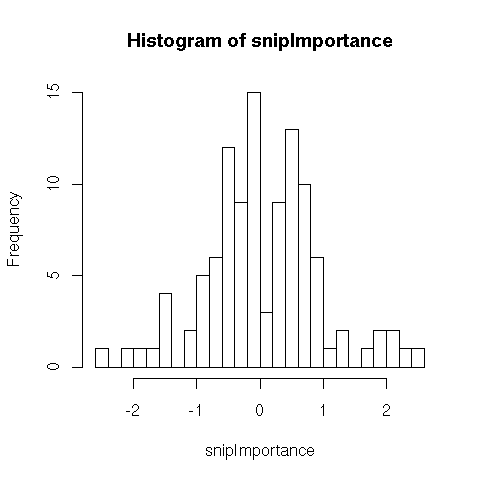
- 108 SNPs (binary, prevalence 0.5) having importance (weights) shown below
- 30 clincial variables (normal with mean 0 and standard deviation .5), weights uniform between -1 and 1
- 3 independent repetitions of recursive partitional
- Most important SNPs: s18 and s27; most important clinical variables: c13 and c8
- Multiply sample size by 10 and repeat
Quantifying Predictive Accuracy
- Proportional classified correctly is an improper scoring rule (optimized by a miscalibrated model)
- Arbitrary and covers up "gray zone" (authors used cutoff of 0.5 risk)
- Loss of statistical power
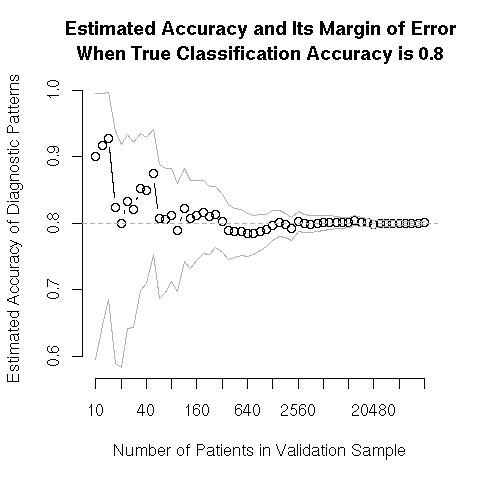
- Authors did independent validation on 114 patients, got 98.2% correct (112/114)
- Authors gave no confidence limits on their validated proportion correct [0.938, 0.995] but will the classification rule transport?
- Need a more continuous measure of discrimination ability that does not require arbitrary classification
- Area under ROC curve (C-index), Brier score
Difficulty in Estimating Accuracy in Small Samples


| I | Attachment |
Action | Size | Date | Who | Comment |
|---|---|---|---|---|---|---|
| |
propCorrect.png | manage | 5.9 K | 14 Apr 2006 - 16:20 | FrankHarrell | Accuracy of Classification Accuracy as a Function of Sample Size |
| |
seb1-1.png | manage | 4.4 K | 17 Apr 2006 - 17:11 | FrankHarrell | |
| |
seb1-2.png | manage | 4.6 K | 17 Apr 2006 - 17:11 | FrankHarrell | |
| |
seb1-3.png | manage | 4.5 K | 17 Apr 2006 - 17:12 | FrankHarrell | |
| |
seb10-1.png | manage | 4.3 K | 17 Apr 2006 - 17:12 | FrankHarrell | |
| |
seb10-2.png | manage | 4.3 K | 17 Apr 2006 - 17:12 | FrankHarrell | |
| |
seb10-3.png | manage | 4.6 K | 17 Apr 2006 - 17:13 | FrankHarrell | |
| |
snipImportance.png | manage | 3.1 K | 17 Apr 2006 - 17:11 | FrankHarrell |
Topic revision: r4 - 17 Apr 2006, FrankHarrell

Ideas, requests, problems regarding Vanderbilt Biostatistics Wiki? Send feedback