You are here: Vanderbilt Biostatistics Wiki>Main Web>Education>HandoutsBioRes>ClinStat>ClinPharmKeyConceptsAndReviewQuestions (revision 5)EditAttach
Lecture 1: Introduction
Key Concepts
- Biostatistics is the application of statistical methods to biological research including laboratory experiments, medical/clincial research, and health service research.
- Statistical thinking needs to be done early, when you are planing your study and before you start collecting data. In particular, do not just think about the analysis when you are ready to write up your results.
- There are many resources at Vanderbilt for obtaining study design and analysis advice
Review Questions
- When and where are the Biostatistics clinic held? Who can attend? What topics are emphasized on each day of the week?
- From the main course web page, find these useful documents
- Glossary of statistical terms
- The article "Detecting skewness from summary information" from the BMJ statistical notes series
- The manuscript checklist detailing some common statistical problems to avoid.


- See Clinics, which has a main link on the Biostatistics web page for all of the information
- You should be able to find these on your own on the main course page. If not, ask someone or email the instructors!
Lecture 2: Descriptive statistics
Key Concepts
- The distribution of a continuous random variable can be summarized by many statistics including the mean, standard deviation, variance, median, and interquartile range, but not all are appropriate in all situations. For example, the mean, sd, and var all assume that the data come from a symmetric distribution; the median and IQR do not require this assumption to be valid measures.
- Dynamite plots are a poor method for summarizing data as they violate many of the principles of good graphic design. Always consider plots that show all of the underlying data, particularly when doing initial exploratory data analysis.
- A well-designed figure or table effectively communicate a wealth of information. Poorly designed figures or tables can hide the real story in the data.
Review Questions
- What are the differences between the (sample) standard deviation and the (sample) standard error of the mean?
- An investigator is interested in describing the underlying distribution of the CD4 count in a group of subjects. Which of the following summary statistics would be appropriate if the CD4 count comes from a distribution that is (a) symmetric, (b) skewed to the right, (c) negatively skewed, and (d) bimodal?
- Mean
- Standard deviation or variance
- Standard error of the mean
- Median
- Interquartile Range
- Histogram
- Empirical cumulative distribution function
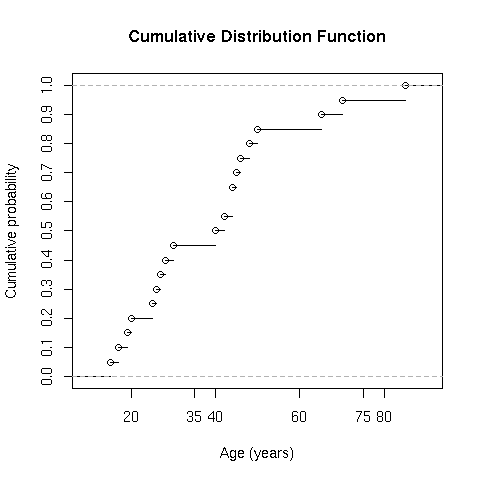
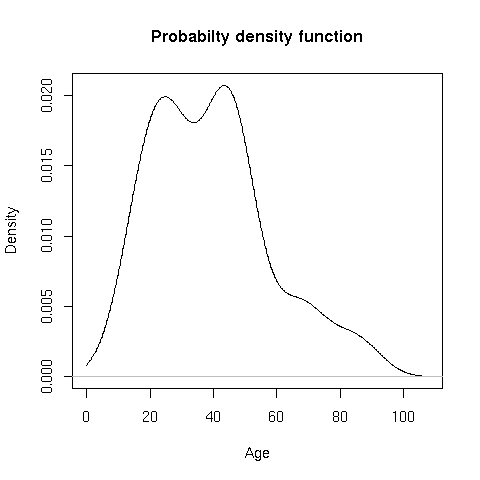
- A study has collected ages in a random sample from a population. Consider the empirical cumulative distribution of ages (Figure 1) and the frequency distribution (Figure 2) to answer the following questions. Note that there are 20 subjects in the sample, so each of your answers should be divisible by 0.05 (e.g. 0.05, 0.10, 0.15, etc)
- What is the estimated probability that age is less than or equal to 35 years?
- What is the estimated probability that age is greater than 75 years?
- What is the estimated probability that age is between 35 and 60 years?
- Describe the shape of the distribution of age using the provided empirical CDF or the probability density (frequency distribution)
- Examine Figure 1 and Figure 2. How could the figures be improved to better compare the empirical CDF to the frequency distribution?
- The standard error is the standard deviation divided by the square root of the sample size. As your sample size increases, the standard error should get closer and closer to zero while the standard deviation approaches the population standard deviation (some number).
- Mean, std dev, and variance: (a) only; Std Error: Never for describing the distribution; Median and IQR: (a), (b), (c); Histogram and emp. CDF: always appropriate
- The probabilities are 0.45, 0.95, and 0.40. The primary characteristic is that it is skewed to the right (positively skewed). With only 20 subjects, I would be hesitant to describe the distribution as bimodal. Finally, there are many possible answers for improving the clarity-- I noticed that the the x-axes were on different scales, which is a common mistake in many plots.
- Figure 1. Empirical Cumulative Distribution Function (Problem 1):
- Figure 2. Probability Density Function (Problem 1):
Lecture 3: Ideas behind hypothesis testing
Key Concepts
- Be able to restate a scientific question into an appropriate, testable null and alternative hypothesis.
- Understand the (convoluted) logic behind hypothesis testing. In particular, we start with a null hypothesis that is assumed to be true, collect data, and then either reject or fail to reject the null based on how well the data and the null hypothesis agree.
- Be able to differentiate between type I (alpha) and type II (beta) errors
Review Questions
- Which of the following statements about p-values are correct? If they are incorrect, why are they wrong?
- Simply stated, a p-value is the probability that the null hypothesis is false
- If I conduct the right test and get p = 0.001, my results are significant
- If I conduct the right test and get p = 0.03, my results are significant
- If I conduct the right test and get p = 0.08, there is a trend towards significant results
- If I conduct the right test and get p = 0.85, the null hypothesis is probably true. If we are comparing two treatments and the null is that they are the same, they are probably equally effective.
- Is it more conservative to use an alpha level of .01 or an alpha level of .05? Would beta be higher for an alpha of .05 or for an alpha of .01?
- All are either completely incorrect, or could be incorrect based on the circumstances of the experiment you are conducting.
- A p-value is the probability of observing data as extreme or more extreme that what was obtained in your experiment. This probability is calculated under the assumption that the null hypothesis is true.
- For p = 0.001 and p = 0.03, statistical significance will depend on your predetermined type I error rate (alpha). Clinical or scientific significance is not taken into account with p-values
- While researchers often like to interpret relatively small p-values as possible trends, this is an incorrect interpretation.
- Large p-values provide no interpretation. There are many reasons that you could obtain a large p-value including poor study design, poor data quality, too few subjects, too much variability, and improper statistical analysis. If the goal is to show that two treatments are "equal", an equivalence study should be designed and analyzed accordingly.
- Choosing a lower significance level, alpha, is more conservative in that you are less likely to reject the null hypothesis when it is true. Generally, in biostatistics applications, making a type I error (e.g. declaring a new treatment beneficial when in truth it is not) is more serious than making a type II error (e.g. failing to show the benefit of a new treatment, even though it has some benefit). There is a trade-off between error rates-- lower alpha will increase beta.
Lecture 4: 1-sample tests
Key Concepts
- Be able to recognize situations where it is appropriate and not appropriate to use a 1-sample t-test
- Understand the relationships between test statistics and p-values
- Be able to test a particular null hypothesis using either a confidence interval or p-value
Lecture 5: 2-sample tests
Key Concepts
- Be able to recognize situations where it is appropriate and not appropriate to use a 2-sample t-test
- Understand the key inputs (alpha, standard deviation, effect size, etc.) used to make sample size or power calculations. Also, know where to find these inputs in the literature or obtain them using pilot studies.
- Be able to carry out simple sample size/power calculations using the PS software, web resources, or other software packages.
Topic revision: r5 - 23 Sep 2009, ChrisSlaughter

Ideas, requests, problems regarding Vanderbilt Biostatistics Wiki? Send feedback