Bosenberg's (1995) Paper and SED Data
Notes
Bosenberg, A. T. (1995) "Skin-epidural distance in children." Anaesthesia. 50: 895-897.- SED Data (digitized from paper figure): Bosenberg1995.csv
- Scanned image from the Bosenberg (1995) paper: Bosenberg1995.png
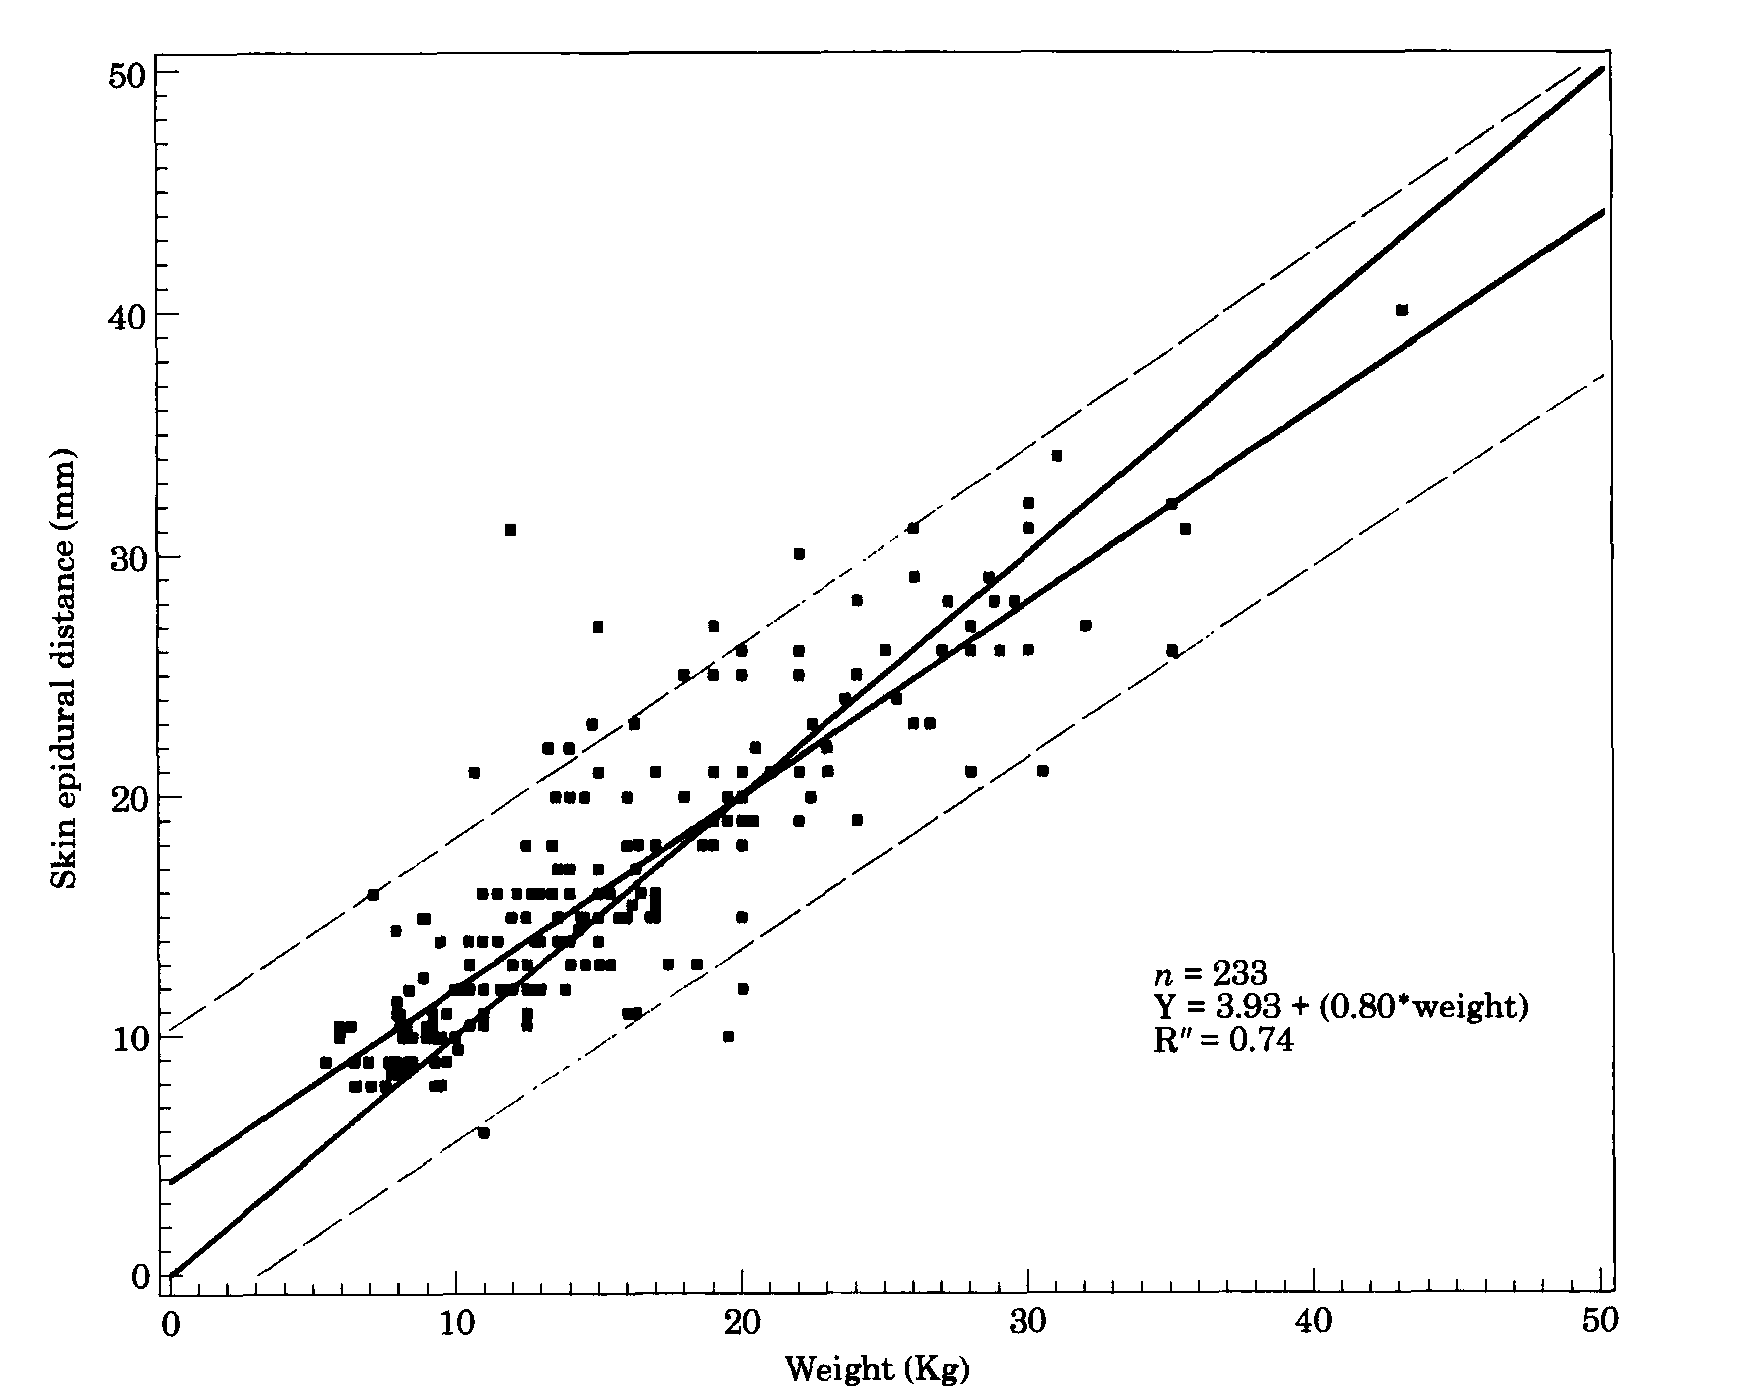
- Digitized SED figure from the Bosenberg paper (Fig. 2): Bosenberg1995.svg
- Fitted linear regression line:
SED = 3.93 + 0.80 * WT, whereSEDis in mm units, andWTis in kg units (R2 = 0.74). - From the paper:
Statistical methods: Regression analysis using the least squares procedure was used to determine the association between the skin-epidural distance and weight. For the difference between the two equations, i.e. the regression equation and the hypothesised 1 mm = 1 kg body weight, a Z-test was performed.
In children over 10 years (n = 19) there was also poor correlation. The data from these patients were not used for further analysis.
Plotting the best fit regression line and its 95% confidence limits shows that the y = x line, or skin-epidural distance (mm) is equal to weight (kg) falls within these limits for weight <40 kg (or 10 years of age) in this series (Fig. 2). Therefore the difference between any two points on these two lines is not statistically significant.
In addition a Z-test performed on any two points obtained from the two equations for a specific weight, i.e. skin-epidural distance (mm) = 0.80 weight (kg) 3.93, and skin-epidural distance (mm) = weight (kg) was found to be not statistically significant.
...In summary, we have demonstrated that 1 mm/kg is a useful guideline for judging the skin-epidural distance in children between 6 months and 10 years of age.
Discussion Points
- Was the confidence band really a prediction band?
- Was it simultaneous or pointwise?
- Was Bosenberg's reasoning sound?
- How can we verify Bosenberg's conclusions?
Assignment
Modify the Bosenberg Sweave file from the previous assignment as follows, and regenerate the PDF report. Ensure that the document remains reproducible.- Add Bosenberg's simplified prediction rule (i.e., 1 mm/kg) to the scatterplot.
- Modify the figure caption to reflect the addition above.
- Use a statistical technique to assess whether Bosenberg's simplified rule was reasonable.
- Add a short discussion of your findings.
Solution
Here is one solution to the assignment above: Bosenberg.Rnw Bosenberg.pdf

| I | Attachment | Action | Size | Date |
Who | Comment |
|---|---|---|---|---|---|---|
| |
Bosenberg1995.svg | manage | 185.3 K | 16 Sep 2012 - 10:02 | MattShotwell | Digitized SED data from Bosenberg (1995) paper |
| |
Bosenberg1995.png | manage | 38.6 K | 17 Sep 2012 - 07:56 | MattShotwell | Scanned image from the Bosenberg (1995) paper. |
| |
Bosenberg.Rnw | manage | 4.2 K | 01 Oct 2012 - 08:51 | MattShotwell | Solution to the Bosenberg assignment |
| |
Bosenberg.pdf | manage | 89.3 K | 01 Oct 2012 - 08:52 | MattShotwell | Solution to the Bosenberg assignment |

Ideas, requests, problems regarding Vanderbilt Biostatistics Wiki? Send feedback